ISO 5167 Orifice Coefficient Calculation Spreadsheet

Introduction to an ISO 5167 Orifice Coefficient Calculation Spreadsheet

For an ISO 5167 orifice coefficient calculation spreadsheetclick here to visit our spreadsheet store.   Read on for information about Excel spreadsheets that can be used to make these ISO 5167 orifice meter calculations.

When ISO 5167 came out in 1991, it included three standard configurations for the pressure taps in an orifice flow meter and equations to calculate the orifice discharge coefficient for a specified ratio of orifice diameter to pipe diameter for any of those three standard pressure tap configurations.  This provided greater flexibility for orifice meters, because orifice plates with different orifice diameters could be used in a given orifice meter, while still allowing accurate determination of the orifice discharge coefficient.

Background on ISO 5167 Orifice Coefficient Calculation Spreadsheet

ISO 5167 Orifice Coefficient Calculation Spreadsheet Diagram
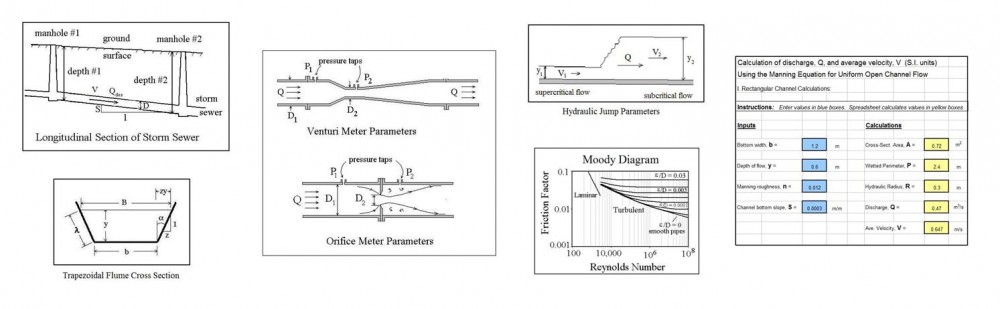
An orifice meter is a simple device for measuring pipe flow rate through the use of a circular plate with a hole in the center (the orifice plate), held in place between pipe flanges, as shown in the diagram at the left.  The fluid pressure decreases downstream of the orifice plate due to the accelerated flow.  The pressure difference shown in the diagram as P1 – P2 can be measured and used to calculate the flow rate passing through the meter (and thus the pipe flow rate) using the equation shown at the right.  This equation allows calculation of pipe flow rate, Q, for measured pressure difference, P1 – P2, and known density of the fluid, ρ, the ratio of orifice diameter to pipe diameter, β, the cross-sectional area of the orifice, Ao, and the orifice discharge coefficient, Cd.

For more details about the orifice, flow nozzle, and venturi meter, see the article, “Excel Spreadsheets for Orifice and Venturi Flow Meter Calculations.”

ISO 5167 Standard Pressure Tap Locations

Prior to ISO 5167 coming out in 1991, the downstream pressure tap of an orifice meter was typically located at the vena contracta (the minimum jet area downstream of the orifice plate) as shown in the diagram above.  The correlations in place for determining the orifice discharge coefficient were for the downstream pressure tap at the vena contracta.  Unfortunately, the distance of the vena contracta fro the orifice plate changes with orifice diameter, so changing to an orifice plate with a different hole diameter required moving the ISO 5167 Orifice Coefficient Calculation Spreadsheet - pressure tapsdownstream pressure tap in order to be able to accurately estimate the orifice discharge coefficient.

The three standard pressure tap configurations identified for orifice flow meters, known as corner taps, flange taps, and D – D/2 taps, are shown in the diagram at the left.  As shown in the diagram, the distance of the pressure taps from the orifice plate is given as a fixed distance, or as a function of the pipe diameter, independent of the orifice diameter, so the orifice discharge coefficient can be calculated for several orifice diameters in a given orifice meter.

Equations for ISO 5167 Orifice Coefficient Calculation Spreadsheet

Included in ISO 5167 is an equation allowing calculation of the orifice discharge coefficient, Cd, for known values of β (d/D), Reynolds number, Re, and L1 & L2, where L1 is the distance of the upstream pressure tap from the orifice plate and L2 is the distance of the downstream pressure tap from the orifice plate.  For corner taps:  L1 = L2 = 0;  for flange taps:  L1 = L2 = 1″ ;  and for D-D/2 taps:  L1 = D & L2 = D/2.   The ISO 5167 equation for the orifice discharge coefficient is:

Cd – 0.5959 + 0.0312 β2.1 – 0.1840 β8 + 0.0029 β2.5(106/Re)0.75 + 0.0900(L1/D)[β4/(1 – β4)] – 0.0337(L2/D)β3

This equation is usable  to find the orifice discharge coefficient for an orifice flow meter with any of the three standard pressure tap configurations, but not for any other arbitrary values of L1 and L2. The introduction of these standard pressure tap configurations and the equation for Cd, allows a given orifice flow meter to conveniently use different size orifice openings and cover a wide flow measurement range.

An iterative (trial and error) calculation is needed to get a value for Cd, because the upstream velocity needed for Re isn’t known until Cd is known.  The ISO 5167 orifice coefficient calculation spreadsheet template shown in the screenshot at the right will calculate the orifice discharge coefficient based on the indicated input information.  The spreadsheet uses an iterative calculation procedure.  It is necessary to assume a value for Re to start the process and replace that value with the calculated Re as any times as necessary until the two Re values are the same.  This ISO 5167 orifice calculation spreadsheet is available in either U.S. or S.I. units at a very low cost in our spreadsheet store.

References:

1. U.S. Dept. of the Interior, Bureau of Reclamation, 2001 revised, 1997 third edition, Water Measurement Manual.

2. International Organization of Standards – ISO 5167-1:2003 Measurement of fluid flow by means of pressure differential devices, Part 1: Orifice plates, nozzles, and Venturi tubes inserted in circular cross-section conduits running full. Reference number: ISO 5167-1:2003.

3. Bengtson, Harlan H., Flow Measurement in Pipes and Ducts, An online continuing education course.

4. Bengtson, Harlan H., “Orifice and Venturi Pipe Flow Meters: for Liquid Flow or Gas Flow,”  an Amazon Kindle e-book.


Air Density Calculator Excel Spreadsheet

Where to Find an Air Density Calculator Excel Spreadsheet

To find an air density calculator Excel spreadsheet to use as an air density calculator, click here to visit our spreadsheet store.  Why use an online calculator or look in tables, when you can get an air density calculator excel spreadsheet to use as an air density calculator here? Read on for information about Excel spreadsheets that can be used to calculate the density of air (and other gases) at different pressures and temperatures with the ideal gas law.

Gas density background for an Air Density Calculator Excel Spreadsheet

Pressure and temperature have significant effects on the density of gases, so some means of determining the density of air and other gases at specified temperatures and pressures is needed for a variety of fluid mechanics applications.  Fortunately, the ideal gas law provides a means of doing this for many gases over ranges of temperature and pressure that are of interest.

The Ideal Gas Law for use in an Air Density Calculator Excel Spreadsheet

A common form for the ideal gas law equation is PV = nRT, giving the relationship among T, the absolute temperature of the gas; P, its absolute pressure; V, the volume occupied by n moles of the gas; and R, the ideal gas law constant.

The density of the gas can be introduced into this equation, through the fact that molecular weight (MW) has units of mass/mole, so that n = m/MW.  This leads to the ideal gas law written as:  PV = (m/MW)RT.  Solving this equation for m/V (which is equal to the gas density, ρ) gives the following equation for gas density as a function of its MW, pressure and temperature:  ρ = (MW)P/RT.

A commonly used set of U.S. units for this equation is as follows:

ρ = density of the gas in slugs/ft3,

MW = molecular weight of the gas in slugs/slugmole (or kg/kgmole, etc.) (NOTE: MW of air = 29),

P = absolute gas pressure in psia (NOTE: Absolute pressure equals pressure measured by a guage plus atmospheric pressure.),

T = absolute temperature of the gas in oR (NOTE: oR = oF + 459.67)

R = ideal gas constant in psia-ft3/slugmole-oR.

For conditions under which air can be treated as an ideal gas (see the next section), the ideal gas law in this form can be used to calculate the density of air at different pressures and temperatures.

The air density calculator excel spreadsheet template shown in the screenshot below will calculate the density of a gas for specified molecular weight, pressure and temperature.   This Excelair density calculator excel spreadsheet spreadsheet is available at a very reasonable price in our spreadsheet store and can be used with either U.S. or S.I. units.  These spreadsheets also contain tables of critical temperature and critical pressure for several common gases.

But When Can I Use the Ideal Gas Law to Calculate the Density of Air?

A good question indeed, because air and other gases for which you may need a density value are real gases, not ideal gases.  It is fortunate, however, that many real gases behave almost exactly like an ideal gas over a wide range of temperatures and pressures.  The Critical Temp and Press for Air Density Calculator Excel Spreadsheetideal gas law works best for high temperatures (relative to the critical temperature of the gas) and low pressures (relative to the critical pressure of the gas).  See table at the left for values of critical temperature and critical pressure for several common gases.  For many practical, real situations, the ideal gas law gives quite accurate values for the density of air (and many other gases) at different pressures and temperatures.

S.I. Units for the Ideal Gas Law

The ideal gas law is a dimensionally consistent equation, so it can be used with any consistent set of units.  For SI units the ideal gas law parameters are as follows:

ρ = density in kg/m3,

P = absolute gas pressure in pascals (N/m2),

T = absolute temperature in oK (NOTE: oK = oC + 273.15)

R = ideal gas constant in Joules/kgmole-K

References:

1. Bengtson, Harlan H., Flow Measurement in Pipes and Ducts, An online PDH course for Professional Engineers

2. Munson, B. R., Young, D. F., & Okiishi, T. H., Fundamentals of Fluid Mechanics, 4th Ed., New York: John Wiley and Sons, Inc, 2002.

3. Applied Thermodynamics ebook, http://www.taftan.com/thermodynamics/

4. Bengtson, Harlan H., “Gas Property Calculator Spreadsheet,” an Amazon Kindle e-book.


Parshall Flume Discharge Calculation – Open Channel Flow Measurement with Excel

Where to find a Parshall Flume Discharge Calculation Spreadsheet

For a Parshall flume discharge calculation Excel spreadsheet to make open channel flow measurement calculations, click here to visit our spreadsheet store. Obtain a convenient, easy to use Parshall flume discharge calculation spreadsheet at a reasonable price.    Read on for information about Excel spreadsheets that can be used for Parshall flume/open channel flow measurement calculations.

picture for parshall flume discharge calculation spreadsheetParshall flumes are used for a variety of open channel flow measurement.  They are especially good for flows containing suspended solids, as for example the flow in wastewater treatment.  As seen in the picture at the right, the plan view of a Parshall flume is similar to that of a venturi flume, with a converging section, a throat, and a diverging section.  A Parshall flume, however, also has prescribed variations in the channel bottom slope as shown in the diagram in the next section.  Flow rate through a Parshall flume can be calculated based on a measured head, using equations that will be discussed in a later section.  A Parshall flume must be constructed with prescribed dimensions as shown in the next section.

Image Credit:   City of Batavia, Illinois

Flume Configuration and Dimensions for Parshall Flume Discharge Calculations

Plan and sectional view - parshall flume discharge calculationThe diagram at the left shows the general configuration of a Parshall flume with a plan and elevation view.  The width of the throat is typically used to specify the size of a Parshall flume.  The table at the right below, shows the standard dimensions for Parshall flumes with throat widths ranging from 1 ft to 8 ft.  Similar information is available for throat widths down to 1 inch and up to 50 ft.

Such a range of sizes covers a very wide range of flow rates.  A 1 inch flume will carry a flow of 0.03 cfs at 0.2 ft of head, while a 50 ft Parshall flume will carry 3,000 cfs at aParshall Flume Dimensions for Parshall Flume Discharge Calculation head of 5.7 ft.   For the range of throat widths in the table, the other dimensions in the diagram are constant at the following values:

E = 3′-0″,  F = 2′-0″,  G = 3′-0″,

K = 3 inches,  N = 9 inches,

X = 2 inches,  Y = 3′

Free Flow and Submerged Flow in Parshall Flume Discharge Calculation

For “free flow” through a Parshall flume, the flow rate through the throat of the flume is unaffected by the downstream conditions.  For free flow, a hydraulic jump will be visible in the throat of the Parshall flume.  For flow situations where downstream conditions cause the flow to back up into the throat, the hydraulic jump isn’t visible, and the flow is said to be “submerged flow” rather than “free flow.”

The ratio between head measurements at the two locations, Ha and Hb, as shown in the diagram at the left above, can be used as a quantitative criterion to differentiate between free flow and submerged flow.  The values of Hb/Ha for free flow and for submerged flow, for several ranges of throat width from 1″ to 8′ are as follows:

For 1” < W < 3” : free flow for Hb/Ha < 0.5; submerged flow for Hb/Ha > 0.5

For 6” < W < 9” : free flow for Hb/Ha < 0.6; submerged flow for Hb/Ha > 0.6

For 1’ < W < 8’ : free flow for Hb/Ha < 0.7; submerged flow for Hb/Ha > 0.7

For 8’ < W < 50’ : free flow for Hb/Ha < 0.8; submerged flow for Hb/Ha > 0.8

Excel Formulas for Free Flow Parshall Flume Discharge Calculation

The free flow equation for Parshall flume discharge calculation is QfreeC Han, where

  • Qfree = the open channel flow rate through the Parshall flume under free flow conditions, cfs for U.S. units or  m3/s for S.I.
  • Ha = the head measured at the correct point in the converging section of the Parshall flume as described in the previous section,  ft for U.S. units or m for S.I. units
  • C and n are constants for a given Parshall flume throat width, W.

The tables below give the constants C and n in the equations for free flow Parshall flume discharge calculation for both U.S. units and for S.I. units.

constants for Parshall flume discharge calculation - U.S. unitsconstants for Parshall flume discharge calculation - S.I. units


free flow Parshall flume discharge calculation spreadsheet


The screenshot at the right shows a Parshall flume discharge calculation spreadsheet that will calculate flow rate through the Parshall flume under free flow conditions in S.I. units for a selected throat width and a specified value for the measured head.   This Excel spreadsheet and one for submerged flow calculation are available in either U.S. or S.I. units at a very low cost in our spreadsheet store.


Excel Formulas for Submerged Flow Parshall Flume Discharge Calculation

The submerged flow equations for Parshall flume discharge calculation, as used by the Excel formulas in the spreadsheet below, are summarized for U.S. units and for S.I. units in the diagrams below:

submerged flow equations for Parshall flume discharge calculation - U.S. unitssubmerged flow equations for Parshall flume discharge calculation - S.I. units


The primary submerged flow equation Parshall flume discharge calculation is:                QsubmQfree – Qcorr, where

  • Qsubm = the flow rate through the Parshall flume for a submerged flow condition, in cfs for U.S. units or  m3/s for S.I. units
  • Qfree =  the flow rate calculated with the equation, Qfree = C Han, as described in the previous section, in cfs for U.S. units or  m3/s for S.I. units
  • Qcorr is a flow correction factor calculated from the equations shown above for the correct throat width, W, in cfs for U.S. units or  m3/s for S.I. units

submerged flow Parshall flume discharge calculation spreadsheet


The screenshot of an Excel spreadsheet template shown at the left will carry out submerged flow Parshall flume discharge calculation in U.S. units for a selected throat width and a specified value for the measured heads, Ha and Hb.   This Excel spreadsheet and one for free flow calculation are available in either U.S. or S.I. units at a very low cost in our spreadsheet store.


References

1. U.S. EPA, Recommended Practice for the Use of Parshall Flume and Palmer Bowlus Flumes in Wastewater Treatment plants, EPA600/2-84-180, 1984

2. Wahl, Tony L., Equations for Computing Submerged Flow in Parshall Flumes, Bureau of Reclamation, Denver, Colorado, USA

3. U.S. Dept. of the Interior, Bureau of Reclamation, Water Measurement Manual, 2001 revised, 1997 third edition


Watershed Time of Concentration Calculation with an Excel Spreadsheet

Where to find Excel Spreadsheets for Watershed Time of Concentration

To obtain an Excel spreadsheet for watershed time of concentration calculations, click here to visit our spreadsheet store.   Obtain a convenient, easy to use spreadsheet for watershed time of concentration calculation at a reasonable price. Read on for information about Excel spreadsheets that can be used for watershed time of concentration calculations.

The time of concentration for a watershed is the time for rainfall that lands on the farthest point of the watershed to reach the outlet.  The main reason for interest in the watershed time of concentration is for its use as the storm duration in finding the design rainfall intensity to use in Rational Method calculation of peak storm water runoff rate.

The reason that the watershed time of concentration is used as design storm duration is because it gives the largest peak storm water runoff rate for a given return period.  This can be reasoned out as follows:  If the storm duration is less than the time of concentration, then the storm will end before runoff from the entire watershed reaches the outlet.  Thus flow from the entire watershed will never all be contributing to the outflow.  If the storm duration is greater than the time of concentration, then the storm will continue longer than it takes for the entire watershed to contribute to the outflow, but the storm intensity will be less for a storm of longer duration than one of short duration for a given return period.  Thus the maximum peak storm water runoff rate for a specified return period on a given watershed will be for a storm with duration equal to the time of concentration of that watershed.

We can now move on to a discussion of how to calculate values for the time of concentration of a given watershed.

Methods for Estimating Watershed Time of Concentration

There are several empirical equations that have been developed for calculating travel time/time of concentration for different types and conditions of watersheds.  Some examples are the Kerby equation, the Izzard equation, the Manning Kinematic equation, the Bransby Williams equation, the National Resources Conservation Service (NCRS) method, and the Manning equation.  The following three equations will be discussed in this article:  1) the Manning Kinematic equation for use with overland sheet flow, 2) the NRCS method for shallow concentrated flow, and 3) the Manning equation for channel flow.  These three methods are recommended by the U.S. Soil Conservation Service (SCS) in ref #1 at the end of this article.  The Iowa Stormwater Management Manual (ref #2) also recommends these three methods.  Typically overland sheet flow will occur in the upper portion of the watershed, followed by shallow concentrated flow, with channel flow for the final portion of watershed before the outlet.

Calculations with the Manning Kinematic Equation

Manning kinematic equation for watershed time of concentration calculationThe boxes at the right  show the Manning Kinematic equation for U.S. and for S.I. units.  The parameters in the Manning Kinematic equation and their units are as follows:

  • t1 = overland sheet flow runoff travel time, min (NOTE: many places show the constant being 0.007 for U.S. units giving the time in hours. The equations in the boxes both give travel time in minutes.)
  • n = Manning roughness coefficient, dimensionless*
  • L = length of flow path, ft (S.I. – m)
  • P = 2 year, 24 hr rainfall depth, in (S.I. – m)
  • S = ground slope, ft/ft (S.I. m/m)

*See table of n values below.

The screenshot of an Excel spreadsheet template shown below will calculate overland sheet flow  travel time with U.S. units using the Manning kinematic equation, based on the input values entered for the other parameters listed above.  A tables with values of the Manning roughness coefficient for various overland flow conditions is also given below.  This Excel spreadsheet and others for time of concentration calculations are available in either U.S. or S.I. units at a very low cost in our spreadsheet store.

n values for watershed time of concentration calculation
watershed time of concentration spreadsheet


Watershed Time of Concentration Calculations with the NRCS Method

The Manning Kinematic equation is recommended for travel length of no greater than 300 ft in ref #1 and for no greater than 100 ft in ref #2.  Both of these references recommend use of the NCRS method for the shallow concentrated flow that normally develops within 100 to 300 ft into the watershed.  The NCRS method calculates the velocity of the shallow concentrated flow first, based on the slope and the type of surface.  The travel time is then calculated as travel length divided by velocity of flow.  The equations used for the NRCS method are:

  • t2 = L/(60V) ( for either U.S. or S.I. units )
  • V = 16.1345 S0.5 for U.S. units ( V = 4.9178 S0.5 for S.I. units) for an unpaved surface
  • V = 20.3282 S0.5 for U.S. units ( V = 6.1960 S0.5 for S.I. units) for a paved surface

An explanation of each of the parameters used in these equations follows:

  • L is the length of the flow path in ft for U.S. or m for S.I. units
  • V is the velocity of flow in ft/sec for U.S. or m/s for S.I. units
  • S is the slope of the flow path, which is dimensionless for either U.S. or S.I. units
  • t2 is the travel time for shallow concentrated flow in minutes (for either U.S. or S.I. units)

spreadsheet for watershed time of concentrationThe screenshot of an Excel spreadsheet template shown at the left will calculate shallow concentrated flow  travel time with S.I. units using the NRCS method, based on the input values indicated.  This Excel spreadsheet and others for time of concentration calculations are available in either U.S. or S.I. units at a very low cost at www.engineeringexceltemplates.com or in our spreadsheet store.

Calculation of Travel Time with the Manning Equation

The Manning equation is used for quite a variety of open channel flow calculations.  It is recommended in ref#1 and ref #2 for any channel flow portion of the watershed runoff path.  The following equations are used for Manning equation calculations:

  • The Manning equation in U.S. units: Q = (1.49/n)A(R2/3)(S1/2)
  • The Manning equation in S.I. units: Q = (1.0/n)A(R2/3)(S1/2)
  • R = A/P
  • V = Q/A
  • t3 = L/(60V)

An explanation of the parameters in these equations and their U.S. and S.I. units follows:

  • Q = channel flow rate in cfs for U.S. units or m3/s for S.I. units
  • V = average velocity of flow in ft/sec for U.S. units or m/s for S.I. units
  • R = hydraulic radius of the channel (= A/P) in ft for U.S. units or m for S.I. units
  • A = channel cross-sectional area in ft2 for U.S. units or m2 for S.I. units
  • P = wetted perimeter of channel in ft for U.S. units or m for S.I. units
  • S = channel bottom slope, which is dimensioness for either set of units
  • n = Manning roughness coefficient for channel
  • L = length of flow path in ft for U.S. units or m for S.I. units
  • t3 = travel time for channel flow in min for either set of units

watershed time of concentration spreadsheet2The screenshot of an Excel spreadsheet template shown at the right will calculate channel flow  travel time with U.S. units using the NRCS method, based on the input values indicated.  This Excel spreadsheet and others for time of concentration calculations are available in either U.S. or S.I. units at a very low cost at www.engineeringexceltemplates.com or in our spreadsheet store.

The overall time of concentration can now be calculated as the sum of t1, t2 and t3.

References:

1. U.S. Soil Conservation Service, Technical Note – Hydrology No N4, June 17, 1986.

2. Iowa Stormwater Management Manual, Section on Time of Concentration.

3. Knox County Tennessee Stormwater Management Manual, section on the Rational Method.

4.Bengtson, Harlan H., Hydraulic Design of Storm Sewers, Including the Use of Excel, an online, continuing education course for PDH credit.

5. Bengtson, Harlan H., “Spreadsheets for Rational Method Hydrological Calculations,” an Amazon Kindle e-book.

V Notch Weir Calculator Excel Spreadsheet

Where to Find a V Notch Weir Calculator Excel Spreadsheet

To obtain a V notch weir calculator Excel spreadsheet, click here to visit our spreadsheet store. Why use online calculators or hand calculations when you can buy a V-notch weir calculator excel spreadsheet for only $11.95.  Read on for information about Excel spreadsheets that can be used as v-notch weir open channel flow calculators.

As you can see in the diagrams and picture below, the name, v notch weir, is a good description of the device, simply a v shaped notch in a plate placed in an open channel so that the water is forced to flow through the v notch.  It can be used to measure the open channel flow rate, because the height of water above the point of the v notch can be correlated with flow rate over the weir.  The v-notch weir works well for measuring low flow rates, because the flow area decreases rapidly as the head over the v notch gets small.

Background for Sharp Crested Weirs

Picture for V notch weir calculator excel spreadsheetThe v notch weir is only one of several possible types of sharp crested weirs.  The image at the left shows a picture of a v-notch weir. Acknowledgement of Image Source:              RS Hydro www.rshydro.co.uk                            The diagram below right shows a longitudinal cross-section of a sharp crested weir with several commonly used parameters identified on the diagram.  The weir crest is the term used for the top of the weir.  In the case of a v notch weir, the crest is the point of the v-shaped notch.  The term nappe refers to the sheet of water flowing over the weir.  The equations to bediagram for v notch weir calculator excel spreadsheet  discussed in this article for calculating flow over a v-notch weir require free flow over the weir.  This means that there must be air under the nappe, as shown in the diagram.  The drawdown is the decrease in water level going over the weir caused by the acceleration of the water.  The measurement, H, shown in the diagram is referred to as the head over the weir.  P in the diagram is the height of the weir crest, and the open channel flow rate (also the flow rate over the weir) is shown as Q.

Picture Credit:  U.S. Forest Service

A V Notch Weir Calculator Excel Spreadsheet for a 90 Degree Notch Angle

v notch weir calculator excel spreadsheet diagram

The equation shown below is recommended by the U.S. Dept. of the Interior, Bureau of Reclamation in their Water Measurement Manual (ref #1 below) for calculations with a fully contracted, 90o, v notch, sharp crested weir with free flow conditions and 0.2 ft < H < 1.25 ft.

In U. S. units:  Q = 2.49H2.48, where Q is discharge in cfs and H is head over the weir in ft.

In S.I. units:  Q = 1.36H2.48, where Q is discharge in  m3/s and H is head over the weir in m.

The conditions for the v notch weir to be fully contracted are:

H/P < 0.4,    H/B < 0.2,    P > 1.5 ft (0.45 m),   B > 3 ft (0.9 m)

The diagram above shows the parameters H, P, θ and B for a v notch weir as used for open channel flow rate measurement in a v notch weir calculator excel spreadsheet.

Screenshot of a V Notch Weir Calculator Excel Spreadsheet

The screenshot below shows a v notch weir calculator excel spreadsheet for making 90o, v-notch weir calculations in U.S. units.  Based on specified values for H, P, & S, along with Hmax, the maximum expected head over the weir, the spreadsheet checks on whether the required conditions for fully contracted flow are met and then calculates the flow rate, Q.  This Excel spreadsheet and others for v notch weir calculations are available in either U.S. or S.I. units at a very low cost (only $11.95)  in our spreadsheet store.

References:

1. U.S. Dept. of the Interior, Bureau of Reclamation, 2001 revised, 1997 third edition, Water Measurement Manual, available for online use or download at: http://www.usbr.gov/pmts/hydraulics_lab/pubs/wmm/index.htm.

2. Bengtson, Harlan H., Open Channel Flow III – Sharp Crested Weirs, an online continuing education course for PDH credit, http://www.online-pdh.com/engcourses/course/view.php?id=87

3. Munson, B. R., Young, D. F., & Okiishi, T. H., Fundamentals of Fluid Mechanics, 4th Ed., New York: John Wiley and Sons, Inc, 2002.