Where to Find a Tutorial on How to Draw V and M Diagrams
To obtain a tutorial program on how to draw V and M diagrams, click here to visit our download store. Look for “Understanding V and M Diagrams” in the “Strength of Materials” category to find it. This standalone program provides practice for learning the principles underlying shear diagrams and bending moment diagrams. You can buy this convenient tutorial beam diagrams program on how to draw shear and bending moment diagrams for a very reasonable price (only $4.95).
A Description of the Tutorial Program on How to Draw V and M Diagrams
This standalone program contains over 50 exercises, which have been chosen to represent all common boundary conditions and load cases for structural beams. The difficulty of the exercises ranges from easy to challenging.
The program is highly interactive: starting with a point at the origin of the shear diagram, the user calculates the coordinates of the next point where the diagram changes slope or direction. Then the user employs the mouse cursor to plot this point on the screen. After plotting the point, the user specifies the type of curve (for example, straight line or curved line concave up), connecting the two points. The user proceeds in a similar manner to plot the next point on the diagram and connect it to the most recently plotted point. Continuing in this fashion, the user completes the shear diagram and then goes on to the bending moment diagram.
Five kinds of Help screens are available:
- A step-by-step tutorial on how to operate the program is provided which guides the user through a simple example on how to draw V and M diagrams.
- Diagrams defining sign conventions for V (shear) and M (bending moment) are given.
- Techniques for calculating V and M are described in terms of specific numerical calculations.
- The answer for the current step in the diagram construction is given—the value of V or M or type of curve connecting two points on the diagram. How the answer is calculated is explained in detail.
- A complete numerical example showing both shear and bending moment diagrams with key values labeled on the diagrams is provided. When the user positions the mouse cursor over any part of the diagram, a pop-up window opens containing an explanation of how that particular part of the diagram was constructed. For example, positioning the cursor over the point of maximum moment on the beam (which is loaded with a distributed load) brings up the comment that the maximum moment occurs where the shear is zero. Positioning the cursor over a jump in the shear diagram brings up the comment that the jump is caused by the support reaction acting on the beam.
A quiz facility is also provided for use of the program in a classroom setting.
Screenshot of Tutorial Program on How to Draw V and M Diagrams
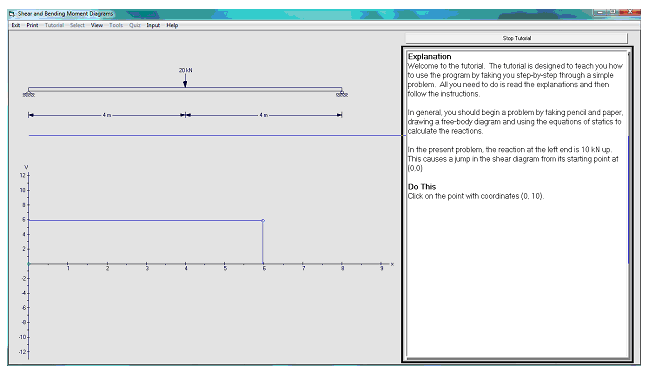
The beginning of the tutorial on How to Draw V and M Diagrams is shown in the image below. This program can be used to help understand shear and bending moment diagrams and how to construct them.
Figure 1. A Tutorial Program on How to Draw V and M Diagrams
Reference
Rossow, M., Shear and Bending Moment Diagrams – A Tutorial, a blog article at: http://www.engineeringexceltemplates.com/blog.aspx

