Where to Find MBBR MBR SBR Spreadsheets
To obtain MBBR MBR SBR spreadsheets, click here to visit our spreadsheet store. You can buy your choice of several different MBBR MBR SBR spreadsheets as a convenient MBBR-MBR-SBR spreadsheet bundle or Excel spreadsheets for wastewater treatment design for MBBR wastewater treatment, MBR wastewater treatment or SBR wastewater treatment for very reasonable prices. This Excel spreadsheet bundle include process design calculations for MBBR wastewater treatment processes, MBR wastewater treatment processed, SBR wastewater treatment processes. These Excel spreadsheets are available in either U.S. units or S.I. units. Read on for more information about MBBR MBR SBR Spreadsheets.
MBBR processes in Wastewater Treatment Spreadsheet Bundles
MBBR wastewater treatment process design spreadsheets are included in all of the MBBR-MBR-SBR spreadsheet bundle mentioned above. The MBBR wastewater treatment process is quite flexible. It is used for domestic and industrial wastewater treatment and can be designed for BOD removal alone or in combination with nitrification or with nitrification and denitrification. It is used as a single stage process or as a two-stage or three-stage process.
The diagram below shows the general configuration of a Pre-anoxic nitrification denitrification MBBR wastewater treatment process. Denitrification can also be carried out in a Post-Anoxic nitrification denitrification process.
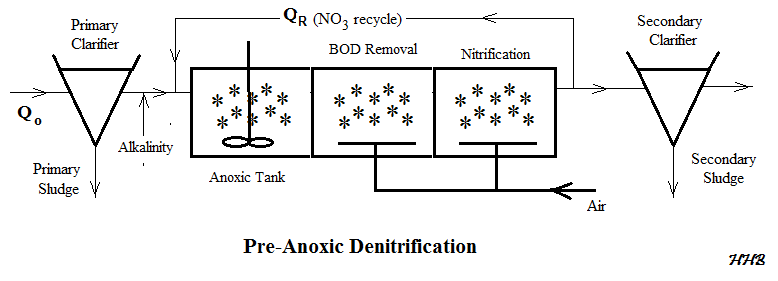
Figure 1. MBBR Wastewater Treatment Flow Diagram for Pre-Anoxic Deniitrification
MBR Processes in Wastewater Treatment Spreadsheet Bundles
A membrane bioreactor wastewater treatment system (MBR) can provide a compact alternative to the conventional activated sludge process. The MBR process uses filtration through a membrane instead of secondary clarification, so it produces a very high quality effluent. Primary clarification is not typically used in a membrane bioreactor wastewater treatment system. Fine screening is needed as a minimum pretreatment, and depending upon wastewater characteristics, coarse screening and grit removal may be needed also. The diagram below shows a general flow diagram for a MBR wastewater treatment system for BOD removal and nitrification.
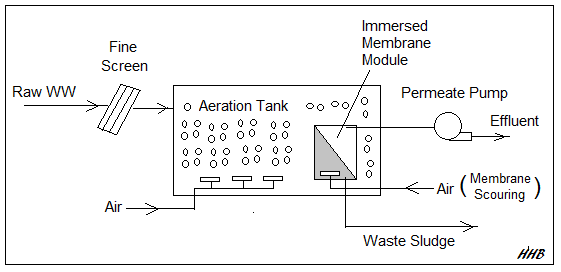 Figure 2. MBR Wastewater Treatment Flow Diagram for BOD Removal and Nitrification
Currently the membrane module is typically immersed in the aeration tank as shown in the flow diagram. Denitrification can also be carried out by adding a preanoxic tank before the aeration tank.
References:
1. McQuarrie, J.P. and Boltz, J.P., Moving Bed Bio-film Reactor Technology: Process Design and Performance, Water Environment Research, Vol 83, No 6, June 2011.
2. Bengtson, Harlan, “MBBR-MBR-SBR Spreadsheet Bundle,” an online blog article
3. Bengtson, Harlan, “MBR Wastewater Treatment Process Design,” an online blog article
3. Bengtson, Harlan H., “Biological Wastewater Treatment Process Design Calculations,” available as an Amazon Kindle ebook or as a paperback.