Hydraulic Grade Line – Energy Grade Line Calculator Spreadsheet

Where to Find a Hydraulic Grade Line – Energy Grade Line Calculator Spreadsheet

To obtain a  hydraulic grade line – energy grade line calculator spreadsheet for calculating and plotting HGL and EGL, click here to visit our spreadsheet store.  Intended for use in calculating and plotting HGL and EGL for up to 10 points of stormwater flow along a storm sewer line, you can buy a convenient spreadsheet to make HGL and EGL calculations and plots for a very reasonable price.  This spreadsheet is available in either U.S. or S.I. units.  Read on for information about a storm sewer hydraulic grade line – energy grade line calculator spreadsheet.

Equations for Hydraulic Grade Line and Energy Grade Line

The equations for the Hydraulic Grade Line and Energy Grade Line (EGL) are:

Hydraulic Grade Line - Energy Grade Line Calculator equationsWhere:    HGL

HGL = hydraulic grade line in ft                EGL = energy grade line in ft

P = pressure in psf                                        γ = specific weight in lb/ft3

h = elevation in ft                                         V = velocity in ft/sec

g = acceleration of gravity in ft/sec2

Example Spreadsheet for Hydraulic Grade Line – Energy Grade Line Calculator Plots

A screenshot for a Hydraulic Grade Line – Energy Grade Line calculator  spreadsheet is partially shown in the image below.  This Excel spreadsheet can be used to calculate and plot the energy grade line and hydraulic grade line.  This Excel spreadsheet, as well as others for stormwater management calculations, is available in either U.S. or S.I. units for a very reasonable price in our spreadsheet store.

hydraulic grade line - energy grade line calculator plot

Reference:

Bengtson, Harlan H., Hydraulic Grade Line Calculation Spreadsheet, an informational blog article

Design Storm Hyetograph Generation Spreadsheet

Where to Find a Design Storm Hyetograph Generation Spreadsheet

To obtain a Design Storm Hyetograph Generation excel spreadsheet, click here to visit our spreadsheet store.  For use in stormwater management calculation, you can buy a convenient Design Storm Hyetograph generation excel spreadsheet for a very reasonable price?  This spreadsheet will generate a design storm hyetograph using the Chicago storm model, a triangular storm model or the “alternating blocks” procedure in either U.S. or S.I. units.  Read on for information about Excel spreadsheets that can be used for design storm hyetograph generation.

Models for Design Storm Hyetograph Generation

Several different hyetograph models can be used for design storm hyetograph generation, including the Chicago storm, triangular, or rectangular (constant intensity design storm) models or the “alternating blocks” procedure for constructing a design storm hyetograph.  An initial step typically needed is the generation of an equation for storm intensity as a function of storm duration at the design location, for the design recurrence interval.

The Chicago Storm Hyetograph

Chicago design storm hyetograph equationFor example, the Chicago storm hyetograph model uses the equation at the left for the portion of the hyetograph before the peak storm intensity.  A slightly different equation is used for the portion of the design Chicago Design Storm Hyetograph Examplestorm hyetograph that is after the peak storm intensity.  The resulting hyetograph has the general shape shown in the diagram at the right.  A user specified parameter is r, which is the fraction of the hyetograph that is before the point of peak storm intensity.  The triangular hyetograph model is similar in shape, but the lines before and after the peak storm intensity are straight instead of curved.

Example Design Storm Hyetograph Generation Excel Spreadsheet

The Design Storm hyetograph generation excel spreadsheet partially shown in the image below can be used to generate a triangular or Chicago storm hyetograph as discussed above.  The portion shown is for generating an equation for storm intensity as a function of storm duration.  This Excel spreadsheet, as well as others for stormwater management calculations, is available in either U.S. or S.I. units for a very reasonable price in our spreadsheet store.

Design Storm Hyetograph Generation Spreadsheet Screenshot

References

1. American Iron and Steel Institute, Modern Sewer Design, 4th Edition, 1999.

2. Bengtson, Harlan H., “Chicago Storm Hyetograph Generation Spreadsheet,”  an online informational blog article.

Pipe Culvert Design Spreadsheet Calculations

Where to get a circular pipe culvert design spreadsheet

For pipe culvert design spreadsheets in either U.S. or S.I. units, click here to visit our spreadsheet store.  Obtain convenient, easy to use spreadsheets for culvert design calculations at reasonable prices. Read on for information about the use of Excel spreadsheets for circular culvert design.

Inlet Control and Outlet Control for a Pipe Culvert Design Spreadsheet

One of the general conditions for pipe culvert design calculations is inlet control, in which the flow rate through the culvert is controlled at the inlet end of the culvert by the culvert diameter and other inlet conditions.  The other general condition is outlet control, in which the flow rate is controlled by the outlet conditions and the entire length of the culvert.

Pipe Culvert Inlet Control Design Spreadsheet Calculations

An equation that relates culvert parameters for inlet control conditions in a pipe culvert design spreadsheet is:

Culvert Design Equation for Inlet Control Conditionswhere:

  • HW = headwater depth above inlet invert (ft – U.S. or m – S.I.)
  • D = inside height of the culvert (ft – U.S. or m – S.I.)
  • Q = discharge (cfs – U.S. or m3/s – S.I.)
  • A = cross-sectional area of culvert (ft2 – U.S. or m2 – S.I.)
  • S = culvert slope (dimensionless)
  • K1 = 1.0 for U.S. units or 1.811 for S.I. units
  • Ks = slope constant = -0.5 for a non-mitered or + 0.7 for a mitered inlet
  • Y and c are constants dependent on the type of culvert and type of inlet.

Pipe Culvert Outlet Control Design Calculations

An equation that relates culvert parameters for outlet control conditions in a pipe culvert design spreadsheet is:

Head Loss Equation for Outlet Control Culvert DesignWhere:

  • hL = the head loss in the culvert barrel for full pipe flow (ft – U.S. or m – S.I.)
  • Ku = 29 for U.S. units or 19.63 for S.I. units
  • n = Manning roughness coefficient for the culvert material
  • L = length of the culvert barrel (ft – U.S. or m – S.I.)
  • R = hydraulic radius of the full culvert barrel = A/P (ft – U.S. or m – S.I.)
  • A = cross-sectional area of the culvert barrel (ft2 – U.S. or m2 – S.I.)
  • P = perimeter of the culvert barrel, ft or m
  • V = velocity in the culvert barrel, ft/sec or m/s
  • Ke = loss coefficient for pipe entrance

A spreadsheet screenshot for pipe culvert design calculations


The Excel spreadsheet screenshot below shows part of a spreadsheet for circular culvert design calculations based on inlet control.   Based on the indicated input values, the spreadsheet will calculate the minimum required pipe culvert diameter and the headwater depth for the next larger standard culvert diameter.

For low cost, easy to use spreadsheets to make these calculations in S.I. or U.S. units, click here to visit our spreadsheet store.

screenshot for pipe culvert design spreadsheet

References

1.  Hydraulic Design of Highway Culverts,Third Edition,  Publication No. FHWA-HIF-12-026, U.S. DOT/Federal Highway Administration, April, 2012.

2. Bengtson, Harlan H., “Spreadsheets for Circular Culvert Design.”, an online article.

Detention Pond Routing Spreadsheet Calculations

Where to Find a Detention Pond Routing Spreadsheet

For detention pond routing spreadsheet to carry out routing calculations and plot inflow and outflow hydrographs, click here to visit our spreadsheet store.  Read on for information about the use of a storm water detention pond routing spreadsheet.


Overview Detention Pond Routing with a Spreadsheet

A detention pond routing spreadsheet is used to project an outflow hydrograph from a stormwater Inflow and Outflow Hydrographs from a Detention Pond Routing Spreadsheetdetention pond based on a given inflow hydrograph, stage-storage information for the pond, and stage-outflow information based on the outflow control device.  An output from the routing process is typically a plot of the inflow and outflow hydrographs similar to that shown at the right.  The outflow is often controlled by a rectangular weir, an orifice, and/or a pipe.  In some cases two-stage control is used with perhaps an orifice to provide outflow control for small storms and a weir to control the outflow rate from larger storms.  The routing process should be set up so that changes can be made in outflow control parameters and effects on the outflow hydrograph can then be observed.

Input Information Needed for a Detention Pond Routing Spreadsheet

In addition to an inflow hydrograph like that shown above, stage-storage and stage-outflow information is needed for a detention pond routing spreadsheet.  The stage-storage information would typically be in the form of a table, graph, or equation showing the pond volume, V, as a function of the pond depth, h.  The stage-outflow information is typically in the form of an equation for outflow, O, as a function of pond depth, h, based on the type of outflow control device, as described in the next section.

Stage-Outflow Equations for a detention pond routing spreadsheet

Detention Pond Routing Spreadsheet Weir Outlet DiagramA rectangular weir is one possible outflow control device, often in a riser as shown in the diagram at the left.  The equation for pond outflow  is:     O = CdL(h – P)1.5 where the parameters in the equation are as follow:

  • O = pond outflow = discharge over the rectangular weir in cfs for U.S. units (m3/s for S.I. units)
  • Cd = the discharge coefficient for the weir.  Typical value for U.S. units is 3.3 (1.84 for S.I. units)
  • L = weir length in ft for U.S. units (m for S.I. units)
  • h = stage (depth of water in pond) in ft for U.S. units (m for S.I. units)
  • P = height of weir crest above pond bottom in ft for U.S. units (m for S.I. units)

Equations like this are also available for an orifice outlet, two stage outlet, and pipe outlet.  These equations are given and used in the detention pond routing spreadsheet in either S.I. units or U.S. units in  our spreadsheet store.

The Storage Indication Routing Equation for Detention Pond Routing Spreadsheet Calculations

In addition to the input information described above, a routing equation is needed for a detention pond routing spreadsheet.  A commonly used routing equation is the Storage Indication Equation:

0.5(I1 + I2 )Δt  +  (S1 – 0.5O1Δt)  =  (S2 + 0.5O2Δt) Where:

  • Δt is the time interval used for the inflow and outflow hydrographs in minutes
  • I1 and I2 are successive values of the inflow from the inflow hydrograph (cfs – U.S. or m3/s – S.I.)
  • S1 is the initial value of pond storage (pond volume at the beginning of the storm in cfs – U.S. or m3/s – S.I.)
  • O1 is the initial outflow rate at the beginning of the storm in ft3 – U.S. or m3 – S.I.)
  • S2 and O2 are the pond storage and outflow respectively at time Δt after the beginning of the storm in the same units shown above.

For a given inflow hydrograph, I1, I2 , and all subsequent values of inflow for the duration of the storm are known.  Thus if the initial pond volume, S1, and initial pond outflow, O1, are known, then all of the parameters on the left hand side of the equation are known so the value of the right hand side of the equation (S2 + 0.5O2Δt) can be determined.

Now comes the elegant part of the storage indication routing procedure.  As described above S vs h and O vs h must be available, in the form of tables, graphs or equations.  Thus for any value of h, the parameter, S + 0.5OΔt can be determined and values of S and O can be determined for a known value of S + 0.5OΔt.  Thus, by stepwise calculations in a detention pond routing spreadsheet, the outflow hydrograph (O vs t) can be obtained.

An Excel Spreadsheet as a Pond Routing Calculator

The template shown below is a  detention pond routing spreadsheet to carry out the procedure described above.   Why bother to make these calculations by hand?  This Excel spreadsheet can handle rectangular weir, orifice, two-stage (orifice/weir), pipe outflow control, and two-stage (pipe/weir), and is available in either U.S. or S.I. units at a very low cost in our spreadsheet store.  These spreadsheets also generates a table and graph showing the inflow and outflow hydrographs for a given set of input parameters.

screenshot of a detention pond routing spreadsheet

References

1. McCuen, Richard H., Hydrologic Analysis and Design, 2nd Ed, Upper Saddle River, NJ, 1998.


Storm Water Drain Inlet Calculations Spreadsheet

Introduction

For a storm water drain inlet calculations spreadsheet, click here to visit our spreadsheet store.  Read on for information about storm water inlet design and Excel spreadsheets to do the calculations.

Design of storm water drain inlets is basically determining the size opening needed to handle the design peak storm water runoff rate, for the particular type of inlet opening.  The links above also have spreadsheets for calculating the peak storm water runoff rate with the Rational Method equation.

Types of Pavement Drain Inlets

stormwater drain inlet calculations spreadsheet curb inlet figureThe types of pavement drain inlets in common use include curb inlets, gutter inlets and combination inlets.  A curb inlet is just an opening in the curb as shown in the image at the stormwater drain inlet calculations spreadsheet gutter inlet figureleft.  A combination inlet has both a curb opening and a grate opening in the bottom of the gutter as shown in the image at the right.  Gutter inlets typically have a grate over the opening, while curb inlets are storm water drain inlet calculations spreadsheet depressed gutter inlettypically open without a grate, as shown in the pictures.  A sketch of a depressed gutter inlet is shown at the bottom left.

Curb Inlet Image Credit: Lone Star Manhole and Structures

Combination Inlet Image Credit: Robert Lawton – Wikimedia Commons

Depressed Gutter Inlet Image Credit:  H. H. Bengtson

The Weir Model for Sizing Storm Water Drain Inlets

The openings for storm water drains can be modeled as a weir if the opening isn’t completely submerged at the design storm water runoff flow rate.  For a curb opening this would be the case if the depth of storm water at the opening is less than the height of the opening.  For a gutter opening it would occur if the design flow rate of storm water runoff enters the grate around the edges, without completely submerging the opening.

The equation used to size storm drains with unsubmerged openings is theC sharp crested weir equation:  Q = CwLd1.5, where:

  • Q = the design storm water runoff rate that must flow through the inlet in cfs for U.S. or m3/s for S.I. units.
  • Cw = a weir coefficient, which is a dimensionless constant.  Typical values are 2.3 for U.S. units and 1.27 for S.I. units.
  • L = the length of the curb opening (or the length of the the gutter opening in the direction of the storm water flow), in ft for U.S. or m for S.I. units.
  • d = the depth of storm water above the bottom of the curb opening or its depth above the gutter inlet opening in ft for U.S. or m for S.I. units.

The Orifice Model for Sizing Storm Water Drain Inlets

The storm water drain opening can be modeled as an orifice if it will be completely submerged at design flow of storm water runoff.  This would be the case for a curb opening if the water depth is more than the height of the curb opening at design storm water flow.  A gutter opening could be modeled as a weir if the gutter opening is completely submerged at the design storm water runoff rate.  The equation used for sizing storm water inlets with the orifice model is:

Q = Co A(2gde)1/2 ,  where:

  • Q = the design storm water runoff rate that must flow through the inlet in cfs for U.S. or m3/s for S.I. units.
  • Co = the orifice coefficient, which is dimensionless.  The value typically used for storm water inlet design is 0.67.
  • A = the area of the inlet opening in ft2 for U.S. or m2 for S.I. units.
  • g = the acceleration due to gravity (32.2 ft/sec2 for U.S. or 9.82 m/s2 for S.I units).
  • de = the height of storm water above the centroid of the opening in ft for U.S. or m for S.I. units.

Note that de = d – h/2, for a curb opening, where d is the depth of storm water above the bottom of the opening and h is the height of the curb opening.  For a gutter opening,  de = d, where d is the height of storm water above the gutter opening at design storm water flow.

An Excel Spreadsheet as a Storm Water Drain Inlet Design Calculator

The Excel spreadsheet template shown below can be used to calculate the required size of a curb inlet for storm water drainage, based on specified information about the design storm water runoff rate, height of the curb opening, and the height of the storm water above the bottom of the opening.  Why bother to make these calculations by hand?  This Excel spreadsheet and others with similar calculations for a gutter opening are available in either U.S. or S.I. units at a very low cost in our spreadsheet store.

storm water inlet calculations spreadsheet

References:

1. McCuen, Richard H., Hydrologic Analysis and Design, 2nd Ed, Upper Saddle River, NJ, 1998.

2. ASCE. 1992. Design and Construction of Urban Stormwater Management Systems. The Urban Water Resources Research Council of the American Society of Civil Engineers (ASCE) and the Water Environment Federation. American Society of Civil Engineers, New York, NY.

3. Texas Department of Transportation/Online Hydraulic Design Manual/Storm Drain Inlets.


Watershed Time of Concentration Calculation with an Excel Spreadsheet

Where to find Excel Spreadsheets for Watershed Time of Concentration

To obtain an Excel spreadsheet for watershed time of concentration calculations, click here to visit our spreadsheet store.   Obtain a convenient, easy to use spreadsheet for watershed time of concentration calculation at a reasonable price. Read on for information about Excel spreadsheets that can be used for watershed time of concentration calculations.

The time of concentration for a watershed is the time for rainfall that lands on the farthest point of the watershed to reach the outlet.  The main reason for interest in the watershed time of concentration is for its use as the storm duration in finding the design rainfall intensity to use in Rational Method calculation of peak storm water runoff rate.

The reason that the watershed time of concentration is used as design storm duration is because it gives the largest peak storm water runoff rate for a given return period.  This can be reasoned out as follows:  If the storm duration is less than the time of concentration, then the storm will end before runoff from the entire watershed reaches the outlet.  Thus flow from the entire watershed will never all be contributing to the outflow.  If the storm duration is greater than the time of concentration, then the storm will continue longer than it takes for the entire watershed to contribute to the outflow, but the storm intensity will be less for a storm of longer duration than one of short duration for a given return period.  Thus the maximum peak storm water runoff rate for a specified return period on a given watershed will be for a storm with duration equal to the time of concentration of that watershed.

We can now move on to a discussion of how to calculate values for the time of concentration of a given watershed.

Methods for Estimating Watershed Time of Concentration

There are several empirical equations that have been developed for calculating travel time/time of concentration for different types and conditions of watersheds.  Some examples are the Kerby equation, the Izzard equation, the Manning Kinematic equation, the Bransby Williams equation, the National Resources Conservation Service (NCRS) method, and the Manning equation.  The following three equations will be discussed in this article:  1) the Manning Kinematic equation for use with overland sheet flow, 2) the NRCS method for shallow concentrated flow, and 3) the Manning equation for channel flow.  These three methods are recommended by the U.S. Soil Conservation Service (SCS) in ref #1 at the end of this article.  The Iowa Stormwater Management Manual (ref #2) also recommends these three methods.  Typically overland sheet flow will occur in the upper portion of the watershed, followed by shallow concentrated flow, with channel flow for the final portion of watershed before the outlet.

Calculations with the Manning Kinematic Equation

Manning kinematic equation for watershed time of concentration calculationThe boxes at the right  show the Manning Kinematic equation for U.S. and for S.I. units.  The parameters in the Manning Kinematic equation and their units are as follows:

  • t1 = overland sheet flow runoff travel time, min (NOTE: many places show the constant being 0.007 for U.S. units giving the time in hours. The equations in the boxes both give travel time in minutes.)
  • n = Manning roughness coefficient, dimensionless*
  • L = length of flow path, ft (S.I. – m)
  • P = 2 year, 24 hr rainfall depth, in (S.I. – m)
  • S = ground slope, ft/ft (S.I. m/m)

*See table of n values below.

The screenshot of an Excel spreadsheet template shown below will calculate overland sheet flow  travel time with U.S. units using the Manning kinematic equation, based on the input values entered for the other parameters listed above.  A tables with values of the Manning roughness coefficient for various overland flow conditions is also given below.  This Excel spreadsheet and others for time of concentration calculations are available in either U.S. or S.I. units at a very low cost in our spreadsheet store.

n values for watershed time of concentration calculation
watershed time of concentration spreadsheet


Watershed Time of Concentration Calculations with the NRCS Method

The Manning Kinematic equation is recommended for travel length of no greater than 300 ft in ref #1 and for no greater than 100 ft in ref #2.  Both of these references recommend use of the NCRS method for the shallow concentrated flow that normally develops within 100 to 300 ft into the watershed.  The NCRS method calculates the velocity of the shallow concentrated flow first, based on the slope and the type of surface.  The travel time is then calculated as travel length divided by velocity of flow.  The equations used for the NRCS method are:

  • t2 = L/(60V) ( for either U.S. or S.I. units )
  • V = 16.1345 S0.5 for U.S. units ( V = 4.9178 S0.5 for S.I. units) for an unpaved surface
  • V = 20.3282 S0.5 for U.S. units ( V = 6.1960 S0.5 for S.I. units) for a paved surface

An explanation of each of the parameters used in these equations follows:

  • L is the length of the flow path in ft for U.S. or m for S.I. units
  • V is the velocity of flow in ft/sec for U.S. or m/s for S.I. units
  • S is the slope of the flow path, which is dimensionless for either U.S. or S.I. units
  • t2 is the travel time for shallow concentrated flow in minutes (for either U.S. or S.I. units)

spreadsheet for watershed time of concentrationThe screenshot of an Excel spreadsheet template shown at the left will calculate shallow concentrated flow  travel time with S.I. units using the NRCS method, based on the input values indicated.  This Excel spreadsheet and others for time of concentration calculations are available in either U.S. or S.I. units at a very low cost at www.engineeringexceltemplates.com or in our spreadsheet store.

Calculation of Travel Time with the Manning Equation

The Manning equation is used for quite a variety of open channel flow calculations.  It is recommended in ref#1 and ref #2 for any channel flow portion of the watershed runoff path.  The following equations are used for Manning equation calculations:

  • The Manning equation in U.S. units: Q = (1.49/n)A(R2/3)(S1/2)
  • The Manning equation in S.I. units: Q = (1.0/n)A(R2/3)(S1/2)
  • R = A/P
  • V = Q/A
  • t3 = L/(60V)

An explanation of the parameters in these equations and their U.S. and S.I. units follows:

  • Q = channel flow rate in cfs for U.S. units or m3/s for S.I. units
  • V = average velocity of flow in ft/sec for U.S. units or m/s for S.I. units
  • R = hydraulic radius of the channel (= A/P) in ft for U.S. units or m for S.I. units
  • A = channel cross-sectional area in ft2 for U.S. units or m2 for S.I. units
  • P = wetted perimeter of channel in ft for U.S. units or m for S.I. units
  • S = channel bottom slope, which is dimensioness for either set of units
  • n = Manning roughness coefficient for channel
  • L = length of flow path in ft for U.S. units or m for S.I. units
  • t3 = travel time for channel flow in min for either set of units

watershed time of concentration spreadsheet2The screenshot of an Excel spreadsheet template shown at the right will calculate channel flow  travel time with U.S. units using the NRCS method, based on the input values indicated.  This Excel spreadsheet and others for time of concentration calculations are available in either U.S. or S.I. units at a very low cost at www.engineeringexceltemplates.com or in our spreadsheet store.

The overall time of concentration can now be calculated as the sum of t1, t2 and t3.

References:

1. U.S. Soil Conservation Service, Technical Note – Hydrology No N4, June 17, 1986.

2. Iowa Stormwater Management Manual, Section on Time of Concentration.

3. Knox County Tennessee Stormwater Management Manual, section on the Rational Method.

4.Bengtson, Harlan H., Hydraulic Design of Storm Sewers, Including the Use of Excel, an online, continuing education course for PDH credit.

5. Bengtson, Harlan H., “Spreadsheets for Rational Method Hydrological Calculations,” an Amazon Kindle e-book.

Hydrology/Hydrograph Calculations Excel Spreadsheets

Introduction to Hydrology/Hydrograph Calculations Excel Spreadsheets

For hydrologyhydrograph calculations Excel spreadsheetsclick here to visit our spreadsheet store.  Read on for information about hydrographs, their components and baseflow separation.

Use of hydrographs in hydrology applications often involves calculations with tables of values.  Thus Excel spreadsheets are very useful for such calculations.  Read on for information about the components of hydrographs, baseflow separation, generation of unit hydrographs and use of unit hydrographs.

What is a Hydrograph?

For use in hydrology, the term hydrograph means a graph or table of values showing the changes in flow rate over time at a point on a river or stream or some other point of interest.  Possible points of interest for a hydrograph include locations like a storm water drainage outlet from a drainage area or the entrance to a storm water detention system.  Hydrographs are used to show flow patterns following a storm, thus providing information about the storm water runoff rate at the point of interest.

Excel Spreadsheets for Hrdrology Hydrograph Calculations FigureFor a storm hydrograph at a point on a river or stream, there will typically be a gradually decreasing flow rate before the beginning of the storm.  After the storm begins, the flow rate increases as storm water runoff from more of the drainage area reaches the river.  The flow rate (discharge) will typically increase to a peak value and then gradually decrease to the pre-storm level again, as shown in sample hydrograph in the figure at the right.  For a hydrograph where there’s no non-storm water flow, the hydrograph will start at zero flow prior to the storm and go back down to zero flow.

Hydrograph Components – Baseflow and Direct Runoff

Spreadsheets for Hydrology Hydrograph Calculations FigureThe flow represented by a hydrograph for a point on a river or stream is considered to be made up of two parts, the baseflow, which is the normal dry weather flow of the river or stream, and direct runoff, which is the component of flow due to storm water runoff. The direct runoff due to the storm is often the part that is of interest.  In order to determine the direct runoff from a storm, its necessary to separate the baseflow from the hydrograph, leaving the direct runoff hydrograph.  The diagram at the left shows three methods used for baseflow separation: the constant discharge method; the constant slope method; and the concave method.

The constant discharge method simply uses a horizontal line from the point where the hydrograph begins to rise to its intersection with the receding limb.  The baseflow separation line for both the constant slope method and the concave method should intersect with the receding limb at the inflection point (where the receding limb changes from convex to concave).  The time from the peak of the hydrograph to the inflection point of the receding limb is often calculated with the equation:  N = A0.2,  as shown on the diagram.  This is a dimensional equation, in which A is the watershed area in mi2, and N is time in days.  The constant slope method uses a straight line from the point where the hydrograph begins to rise to the inflection point on the receding limb.  The concave method extends the pre-storm slope of the baseflow line to a point directly below the peak and then uses a straight line to the inflection point on the receding limb.

For Excel spreadsheets to make a variety of hydrograph calculations, including baseflow separation by the concave method, click here to visit our spreadsheet store.

Reference

McCuen, Richard H., Hydrologic Analysis and Design, 2nd Ed, Upper Saddle River, NJ, 1998.


Storm Sewer Hydraulic Design with Excel Spreadsheets

Where to Find Storm Sewer Hydraulic Design Spreadsheets

For storm sewer hydraulic design spreadsheets, click here to visit our spreadsheet store.  Read on for information about the use of Excel spreadsheets for storm sewer hydraulic design calculations with the Manning Equation.

One part of storm sewer hydraulic design is determination of the design pipe diameter and sewer slope for the storm sewer pipe between adjacent manholes.  Although storm sewers are circular pipes, the storm water typically flows under gravity, rather than as pressure flow, so the Manning equation for open channel flow can be used for the calculations.  A storm sewer hydraulic design spreadsheet typically makes hydraulic calculations for full pipe flow.  For full pipe flow, the hydraulic radius becomes: R = A/P = (πD2/4)/(πD) = D/4.

The Manning Equation in a Storm Sewer Hydraulic Design Spreadsheet

The general form of the Manning equation in terms of velocity is: V = (1.49/n)(R2/3)(S1/2) for U.S. units and  V = (1.0/n)(R2/3)(S1/2) for S.I. units.  As noted above, R = D/4 for full pipe flow, so the Manning equation in U.S. units becomes  V = (1.49/n)[(D/4)2/3](S1/2) -U.S. units or V = (1.0/n)[(D/4)2/3](S1/2) – S.I units, for full pipe, gravity flow in a storm sewer pipe.  The parameters in the equations are as follows:

  • V is the flow velocity in the pipe (ft/sec – U.S. and m/s – S.I.).
  • n is the Manning roughness coefficient, an empirical, dimensionless constant.
  • D is the pipe diameter (ft -U.S. and m – S.I.).
  • S is the pipe slope, which is dimensionless.

The volumetric flow rate is related to the other parameters through the equation Q = VA or, for a circular pipe flowing full:  Q = (πD2/4)V, where Q will be in cfs for U.S. units or m3/s for S.I. units.

Calculation of Diameter and Slope with a Storm Sewer Hydraulic Design Spreadsheet

Diagram for Storm Sewer Hydraulic Design Spreadsheet
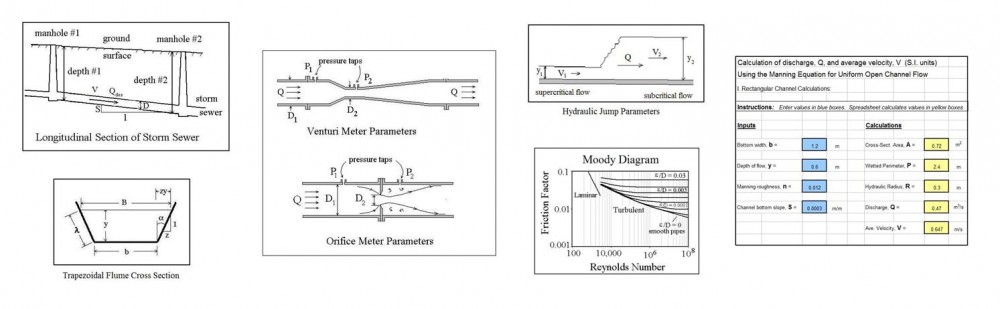
The required diameter and slope for the length of storm sewer between two manholes can be calculated with a storm hydraulic sewer design spreadsheet using the equations presented in the last section (Mannings equation and Q = VA) together with the typical design criteria that 1) the full pipe flow rate that the pipe can carry must be at least equal to the design peak storm water runoff rate to the inlet for that section of storm sewer and 2) the full pipe velocity must be equal to or greater than a specified minimum velocity.  The diagram above shows a sectional view of a storm sewer pipe between two manholes and the parameters being discussed here. The calculation procedure is illustrated by the example in the next section.

Example Storm Sewer Hydraulic Design Calculations

Problem Statement: For a section of storm sewer between two manholes, the design flowrate is: Qdes = 6.4 cfs. The required minimum full pipe storm water velocity is: V min= 3 ft/sec.  The Manning roughness coefficient (concrete pipe) is: n = 0.011.  Find a standard pipe diameter and sewer slope that will meet the two criteria: Qfull > Qdes and Vfull > Vmin for this section of storm sewer pipe.

Problem Solution: First the pipe diameter needed for a full pipe velocity of 3 ft/sec at design flow rate will be calculated using the equation: Q = VA.   Then the Manning equation will be used to calculate the sewer slope needed to give full pipe velocity equal to 3 ft/sec with the next larger standard pipe size.

Step 1:  The equation, Q = VA becomes: Qfull = Vfull(πD2/4). Substituting known values for Qfull and Vfull, the equation becomes: 6.4 = 3(πD2/4).  Solving for D gives: D = 1.65 ft = 19.8 in.  From the list of standard storm sewer pipe sizes in the next section it can be seen that the next standard size larger than 19.8 inches is 21 “, so that will be used for the diameter.

The Manning equation will then be used to calculate the slope for D = 21 in. = 1.75 ft, and V = 3 ft/sec. The Manning equation is: V = (1.49/n)[(D/4)2/3](S1/2).  Substituting values for V, D, and n gives:  3 = (1.49/0.011)[(1.75/4)2/3](S1/2).  Solving this equation for S gives: S = 0.00148.

Thus, the solution is: D = 21″, S = 0.00148. These values of D and S will give Qfull > 6.4 cfs, because Qfull = 6.4 cfs for Vfull = 3 ft/sec and D = 19.8″. With D = 21 ” and V = 3 ft/sec, Qfull must be greater than 6.4 cfs. The equation Q = (πD2/4)V can be used to check this.

Standard Pipe Sizes

Standard U.S. pipe sizes in inches for most types of pipe used as storm sewers:                          4, 6, 8, 10, 12, 14, 16, 18, 21, 24, 27, 30, 33, 36, 39, 42, 48, 54, 60

Standard S.I. pipe sizes in mm for most types of pipe used as storm sewers:                           100, 150, 200, 250, 300, 350, 400, 450, 500, 600, 650, 700, 750, 800, 850, 900, 950, 1000, 1050

Use of Excel Spreadsheets for Storm Sewer Design Calculations

For information on making storm sewer calculations with Excel spreadsheets, see the related article: “Excel Spreadsheets for Storm Sewer Hydraulic Design.”  For low cost, easy to use spreadsheets for several types of storm water calculations, including storm sewer hydraulic design, click here to visit our spreadsheet store.

References

1. Bengtson, Harlan H., Hydraulic Design of Storm Sewers, Including the Use of Excel, an online, continuing education course for PDH credit.

2. McCuen, Richard H., Hydrologic Analysis and Design, 2nd Ed, Upper Saddle River, NJ, Prentice Hall, 1998.

3. Steele, E.W. and McGhee, T.J., Water Supply and Sewerage, New York, NY, McGraw-Hill Book Co, 1979.

4. Bengtson, Harlan H., Hydraulic Design of Storm Sewers with a Spreadsheet,” an Amazon Kindle ebook

5. Bengtson, Harlan H., “Hydraulic Design of Storm Sewers with Excel”  an online blog article.


Storm Sewer Design Spreadsheet Calculations

Where to find a Storm Sewer Design Spreadsheet

For a storm sewer design spreadsheetclick here to visit our spreadsheet store.  Read on for information about the use of Excel spreadsheets for storm sewer design calculations.

The storm sewer design spreadsheet discussed in this article uses Excel formulas with the rational method to find design storm water runoff rate and the Manning equation to find pipe diameter and slope.

The hydraulic portion of stormwater sewer design proceeds in the form of calculations between each pair of manholes in the storm sewer line. The first part of the spreadsheet is essentially a rational method design spreadsheet used to determine the design stormwater runoff flow rate for each section of storm sewer being designed. The next part of the spreadsheet is used to calculate the pipe diameter and slope for each section of storm sewer with the Manning Equation. Finally, the pipe invert elevation at each manhole is calculated in the last part of the spreadsheet.  Each part of the storm sewer design spreadsheet will be discussed briefly in the next several sections, followed by presentation and discussion of an Excel spreadsheet template to make the calculations.

Peak Storm Water Runoff Rate for Storm Sewer Design Spreadsheet

The rational method equation (Q = CiA for U.S. units and Q = 0.0028 CiA for S.I. units) is widely used to calculate the design stormwater runoff rate to use for a variety of storm water projects, including storm water sewer design.  The parameters in the rational method equations are:

  • Q, the design storm water runoff rate (cfs – U.S. and m3/s – S.I.)
  • C, the runoff coefficient, which is an estimate of the fraction of rainfall that becomes surface runoff (dimensionless)
  • i, the design rainfall intensity (in/hr – U.S. and mm/hr – S.I.)
  • A, the runoff area that drains to the section of sewer pipe being designed (acres – U.S. and ha – S.I.)

Manhole Map for Storm Sewer Design Spreadsheet ExampleThe storm sewer design spreadsheet being discussed here will assume that the manhole locations have already been determined, as shown in the diagram above.  A street map like this would be used to determine the area draining to each of the manhole inlets for the length of storm sewer being designed.

Criteria Used in Storm Sewer Design Spreadsheet

Following are the criteria typically used to calculate the design pipe diameter and sewer slope for a length of sewer pipe:

  1. The pipe must be sized to carry the design peak stormwater runoff rate.
  2. The velocity in the sewer pipe must be greater than or equal to the design minimum velocity (usually 3 ft/s).

The use of these design criteria, together with the Manning equation

[ Q = (1.49/n)(A)(R2/3)(S1/2) ]  and Q = VA, to calculate the pipe diameter and slope is discussed and illustrated with an example in the article, “Storm Sewer Hydraulic Calculations with the Manning Equation.”  The procedure is also illustrated in the spreadsheet template presented later in this article.

Invert Elevations at Manholes in the Storm Sewer Design Spreadsheet

The sewer pipe invert elevation (or depth) at the uppermost manhole is determined by the minimum required depth of cover above the sewer pipe to protect it from freezing. This required minimum cover is usually specified by a state or local agency.  For subsequent manholes, the required minimum cover, the required pipe slope, and the ground surface elevations from a street/manhole map like that shown in a previous section above, are used to calculate the pipe invert elevations.  Calculation of the invert elevations at manholes with a storm sewer design spreadsheet is presented in the next section.

Putting it together in a Storm Sewer Design Spreadsheet

The storm sewer design spreadsheet template shown in the two images below contains design calculations for a storm sewer line along one of the streets on the manhole layout map shown above in the second section of this article.  The spreadsheet makes the calculations described above.  The various parts of the spreadsheet will now be discussed briefly with reference to the column numbers given on the spreadsheet.

Columns 1, 2, and 3 contain information from a scale street/manhole map, such as the one shown earlier in this article. Column 4 is the calculated cumulative area draining to downstream sections of storm sewer pipe. The uppermost part of the sewer line in this example is the manhole at 8th Street and Maple Avenue.  An estimate of the runoff coefficient is given in column 5.  Column 6 shows the inlet time from the farthest point in the drainage area. For the uppermost section of sewer pipe, the inlet time is equal to the time of concentration.  For the other sections of sewer pipe in the line being designed, the time of concentration is the inlet time to the first inlet plus the pipe flow time to the inlet of the pipe section currently being designed.  This is calculated in column 7.

Column 8 is the calculated design rainfall intensity. The portion of the Excel template shown at the right below has the Excel formulas for derivation of an equation for storm intensity vs storm duration for a given return period, using linear regression of storm duration, δ, vs the inverse of storm intensity, 1/i.   This requires at least some values of i vs δ, from  I-D-F data for the location of interest.  This linear regression makes use of the fact that the relationship between i and δ is typically of the form i = a/(δ + b), where a and b are constants. Column 9 is the calculation of peak storm water runoff rate (the design flow rate) with the rational method equation:  Q = CiA.

Columns 10 through 15 use of the Manning Equation and Q = VA to determine the minimum standard pipe diameter and sewer slope needed, as well as to make a check on Vfull and Qfull when the pipe is receiving the design stormwater runoff flow rate.  This set of calculations is discussed in some detail in the article: Storm Sewer Hydraulic Calculations with the Manning Equation.”

Columns 16 and 17 are used to calculate the pipe flow time to be used for the time of concentration calculation in column 7. Columns 18 and 19 give ground surface elevations taken from the manhole layout map. Columns 20 and 21 calculate the pipe invert elevations. The invert elevation of the uppermost end of the pipe is taken to be the surface elevation minus the minimum cover (taken to be 5′ ) plus the pipe diameter. The invert elevation at the lower end of the pipe section is calculated using the sewer slope that was previously determined. Columns 22 and 23 are a check on the depth of cover at each manhole, and column 24 is a listing of the final design pipe slope.

For a low cost, easy to use storm water design spreadsheet and spreadsheets for several other types of storm water calculations, click here to visit our spreadsheet store.

screenshot of part of a storm sewer design spreadsheet

References

1. Bengtson, Harlan H., Hydraulic Design of Storm Sewers, Including the Use of Excel, an online, continuing education course for PDH credit.

2. McCuen, Richard H., Hydrologic Analysis and Design, 2nd Ed, Upper Saddle River, NJ, 1998.

3. Knox County Tennessee, Stormwater Management Manual, section on the Rational Method

4. Bengtson, Harlan H., Hydraulic Design of Storm Sewers with a Spreadsheet,” an Amazon Kindle ebook

5. Bengtson, Harlan H., “Hydraulic Design of Storm Sewers with Excel”  an online blog article.