Where to Find Spreadsheets for Activated Sludge Aeration Tank Design
For Excel spreadsheets to use for activated sludge aeration tank design or operation calculations, click here to visit our spreadsheet store. Get an easy to use spreadsheet to make a variety of activated sludge aeration tank design calculations for a very reasonable price. Read on for information about activated sludge aeration tank design and operation calculations.
The activated sludge process is widely used for biological wastewater treatment all over the world. This method of biological wastewater treatment was invented in England in about 1914. An activated sludge wastewater treatment system always has an aeration tank and secondary clarifier, which function as a unit to remove biodegradable organic matter (biochemical oxygen demand or BOD) and suspended solids from the wastewater and keep the aerobic microorganisms that carry out the treatment in the system. Most types of activated sludge processes also have a primary clarifier that removes settleable solids from the incoming wastewater before it goes to the aeration tank. A flow diagram for a typical activated sludge wastewater treatment plant is shown in the diagram below. The diagram shows the typical flow pattern through the primary clarifier, aeration tank and secondary clarifier mentioned above, plus initial preliminary treatment (screening, flow measurement and grit removal) and disinfection, which is usually the final step in wastewater treatment.

This article will emphasize the equations, parameters, and calculations for design and operation of the aeration tank/secondary clarifier of an activated sludge plant.
Parameters for Activated Sludge Aeration Tank Design Calculations
 The diagram at the left shows a typical flow pattern for a conventional activated sludge aeration tank and secondary clarifier. Some of the parameters that are typically used in activated sludge aeration tank design calculations are shown for the primary effluent, secondary effluent, waste activated sludge, and recycle activated sludge. The following list shows those parameters, along with some others that are used for activated sludge calculations, with their U.S. and S.I. units.
- primary effluent flow rate, Qo, (MGD – U.S. or m3/day – S.I.)
- primary effluent biochemical oxygen demand (BOD) concentration, So, (mg/L – U.S. or g/m3 – S.I.)
- primary effluent suspended solids conc., Xo, (mg/L – U.S. or g/m3 – S.I.)
- aeration tank volume, V, (ft3 – U.S. or m3 – S.I.)
- aeration tank MLSS (suspended solids conc.), X, (mg/L – U.S. or g/m3 – S.I.)
- secondary effluent flow rate, Qe, (MGD – U.S. or m3/day – S.I.)
- secondary effluent susp.solids conc., Xe, (mg/L – U.S. or g/m3 – S.I.)
- secondary effluent biochemical oxygen demand (BOD) concentration, Se, (mg/L – U.S. or g/m3 – S.I.)
- waste activated sludge flow rate, Qw, (MGD – U.S. or m3/day – S.I.)
- waste activated sludge biochemical oxygen demand (BOD) conc., Sw, (mg/L – U.S. or g/m3 – S.I.)
- waste activated sludge susp. solids conc., Xw (mg/L – U.S. or g/m3 – S.I.)
- recycle activated sludge flow rate, Qr, (MGD – U.S. or m3/day – S.I.)
- Food to Microorganism ratio, F:M, (lb BOD/day/lb MLVSS – U.S. or kg BOD/day/kg MLVSS – S.I.)
- Hydraulic retention time, HRT, (hours for U.S or S.I.)
- Sludge retention time (also called sludge age), SRT, (days for U.S. or S.I.)
- Volumetric loading, VL, (lb BOD/day/1000 ft3 – U.S. or kg BOD/day/m3 – S.I.)
- % volatile solids in the aeration tank mixed liquor suspended solids, %Vol.
Activated Sludge Aeration Tank Design Calculations with Excel Spreadsheets
The table below shows the typical range of values for three commonly used activated sludge aeration tank design parameters: volumetric loading, hydraulic retention time, and food to microorganism ratio. The table includes design information for three activated sludge variations: conventional plug flow, complete mix, and extended aeration activated sludge plants.

The spreadsheet image below uses Excel formulas to calculate the required aeration tank volume based on values provided for the input parameters shown in the spreadsheet: primary effluent flow rate, Qo; primary effluent biochemical oxygen demand (BOD), So; Aeration tank MLSS, X; design volumetric loading, VL; and % volatile solids in the aeration tank, %Vol. The Excel spreadsheet uses the input data to calculate the design value of aeration tank volume, V, and values for two other design parameters that are sometimes used to size the aeration tank, hydraulic retention time in the aeration tank, HRT, and food to microorganism ratio, F:M, using the following equations.
- V = [ (8.34*So*Qo)/VL ] (1000)
- VMG = V*7.48/1,000,000
- HRT = 24*VMG/Qo
- F:M = (8.34*So*Qo)/(8.34*%Vol*X*VMG) = (So*Qo)/(%Vol*X*VMG)
For Excel spreadsheets to make a variety of activated sludge aeration tank design and operation calculations in either U.S. or S.I. units for a very reasonable price, click here to visit our spreadsheet store.

Activated Sludge Aeration Tank Operational Calculations with Excel Spreadsheets
The table below shows typical ranges for several commonly used operational activated sludge waste water treatment process parameters. Note that the values for all of these parameters remain the same for U.S. or S.I. units. MLSS concentration will have the S.I. unit of g/m3, which is numerically equal to the U.S. units of mg/L. SRT will have units of days for either the U.S. or S.I. system. F:M will have the S.I. unit of kg BOD/day/kg MLVSS, which is numerically equal to the U.S. unit of lb BOD/day/lb MLVSS. The % unit for Qr/Qo remains the same for U.S. or S.I. units.
 The Excel spreadsheet image shown below uses the input values to calculate the activated sludge operational parameters shown. The input parameters required are: primary effluent information (flow rate, Qo; BOD, So; and TSS, Xo); TSS in the waste and recycle activated sludge streams, Xw; the aeration tank volume, V; aeration tank MLSS, X; % volatile solids in the MLSS, %Vol; and sludge retention time, SRT.
The activated sludge operational parameters calculated by the Excel formulas in the spreadsheet are: recycle activated sludge flow rate, Qr; waste activated sludge flow rate, Qw, and aeration tank food to microorganism ratio, F:M. The equations used are as follows:
- Qr = (X – Xo)/(Xw – X)
- VMG = V*7.48/1,000,000
- Qw = (8.34*VMG*X)/(8.34*SRT*Xw) = (VMG*X)/(SRT*Xw)
- F:M = (8.34*So*Qo)/(8.34*%Vol*X*VMG) = (So*Qo)/(%Vol*X*VMG)
For Excel spreadsheets to make a variety of activated sludge aeration tank design and operation calculations in either U.S. or S.I. units at a very reasonable price, click here to visit our spreadsheet store.

References
References for Further Information:
1. Metcalf & Eddy, Inc, (revised by Tchobanoglous, G, Burton, F.L., Stensel, H.D., Wastewater Engineering Treatment and Reuse, 4th Edition, New York, NY, 2003.
2. Vesilind, P.A. and Morgan, S.M., Introduction to Environmental Engineering, 2nd Edition, Belmont, CA, Brooks/Cole, 2004.
3. Grady, C.P.L., Daigger, G.T., Lim, H.C., Biological Wastewater Treatment, 2nd Edition, New York, NY, Marcel Dekker, Inc., 1999.
4. Bengtson, Harlan H. “Biological Wastewater Treatment Process Design Calculations,” available as an Amazon Kindle e-book and as a paperback.
5. Bengtson, Harlan H., “Activated Sludge Calculations Spreadsheet: Aeration Tank Calculations,” an Amazon Kindle e-book.
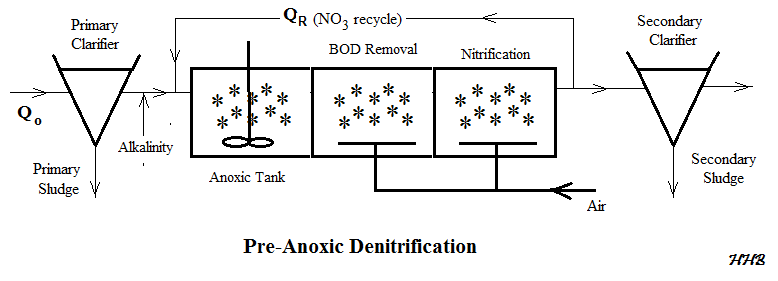
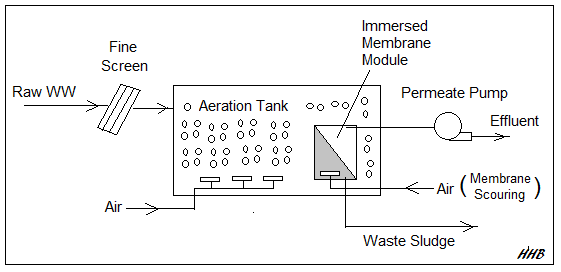 Figure 2. MBR Wastewater Treatment Flow Diagram for BOD Removal and Nitrification


