SBR Denitrification Calculations Spreadsheet

Where to Find an SBR Denitrification Calculations Spreadsheet

To obtain an SBR Denitrification Calculations Spreadsheet, click here to visit our spreadsheet store.  This Excel spreadsheet is intended for making design calculations for either pre-anoxic or post-anoxic denitrification in a sequencing batch reactor. You can buy a convenient SBR denitrification calculations spreadsheet for a very reasonable price.  It is available in either U.S. units or S.I. units.  Read on for background information about sequencing batch reactor denitrification process design calculations.

Background for an SBR Denitrification Calculations Spreadsheet

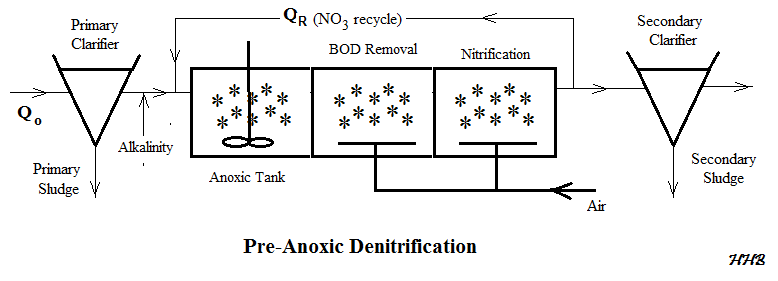
The sequencing batch reactor is a batch type, fill and draw alternative to the continuous flow activated sludge process for biological wastewater treatment, including BOD removal, nitrification and denitrification.  The typical components of a sequencing batch reactor operating cycle for BOD removal and nitrification are shown in the diagram below.

Typical SBR Cycle for SBR denitrification calculations spreadsheet
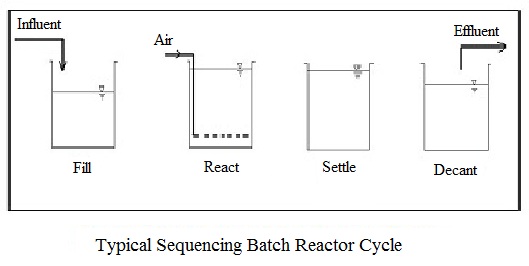
At least two tanks are typically used.  In that case, the length of the fill period would be equal to the sum of the times for the react, settle and decant periods.  Thus one tank would be filling while the other tank was going through the react, settle and decant periods and then the roles would be reversed.

In order to achieve denitrification, an anoxic period must be added.  A typical sequencing batch reactor cycle for a post-anoxic denitrification process is shown in the figure below.  A mixed anoxic react period is included after the aerobic react period.

post-anoxic SBR operating cycle for SBR denitrification calculations spreadsheet
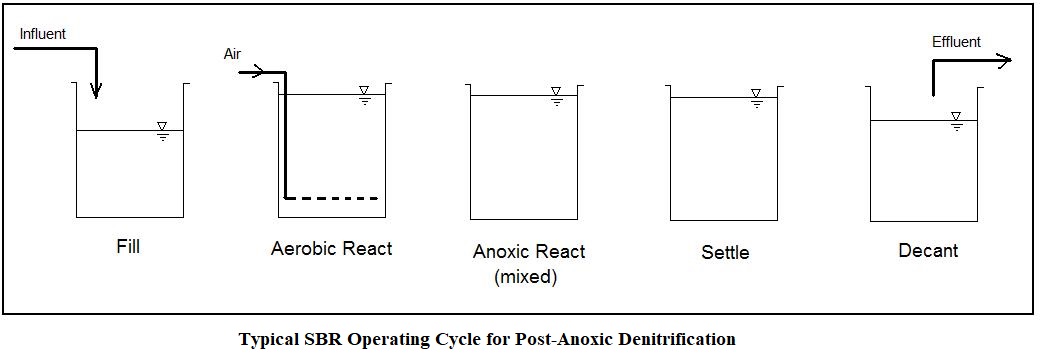
For a pre-anoxic denitrification SBR process, some or all of the fill period would be anoxic and there would be no anoxic react period after the aerobic react period.

 Example SBR Denitrification Calculations Spreadsheet

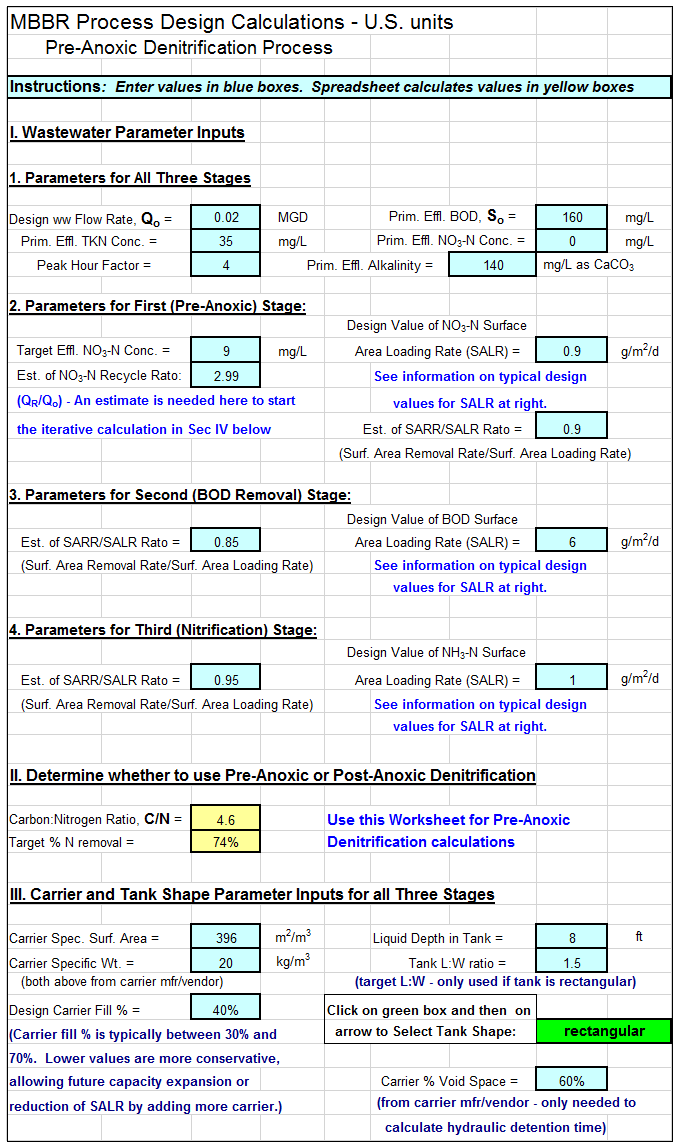
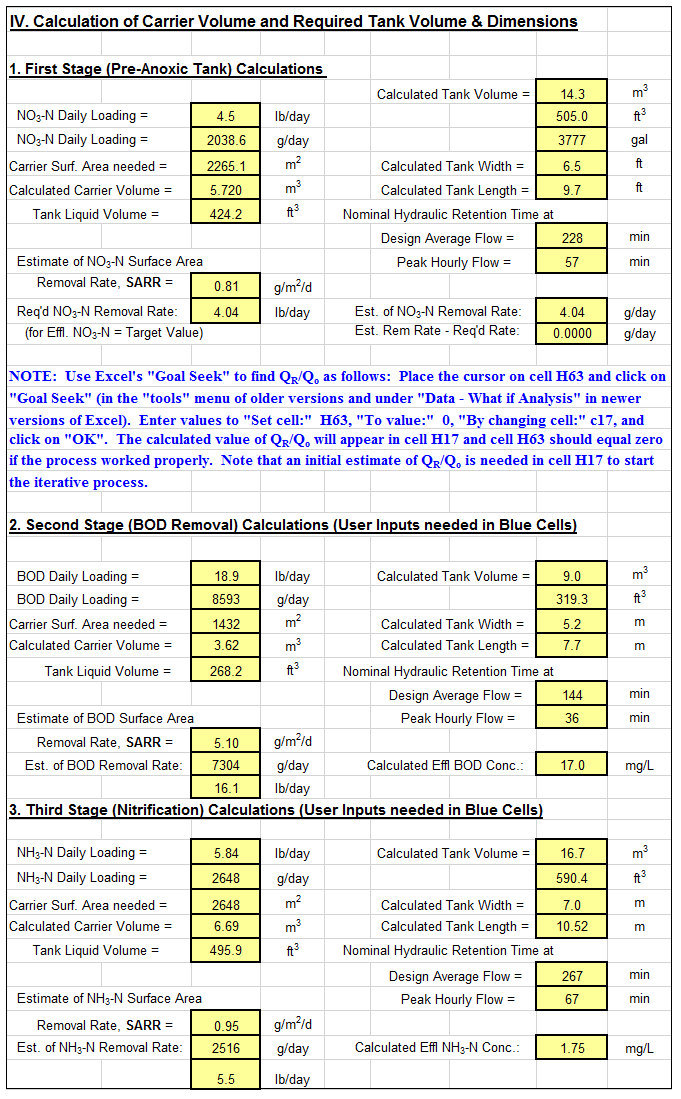
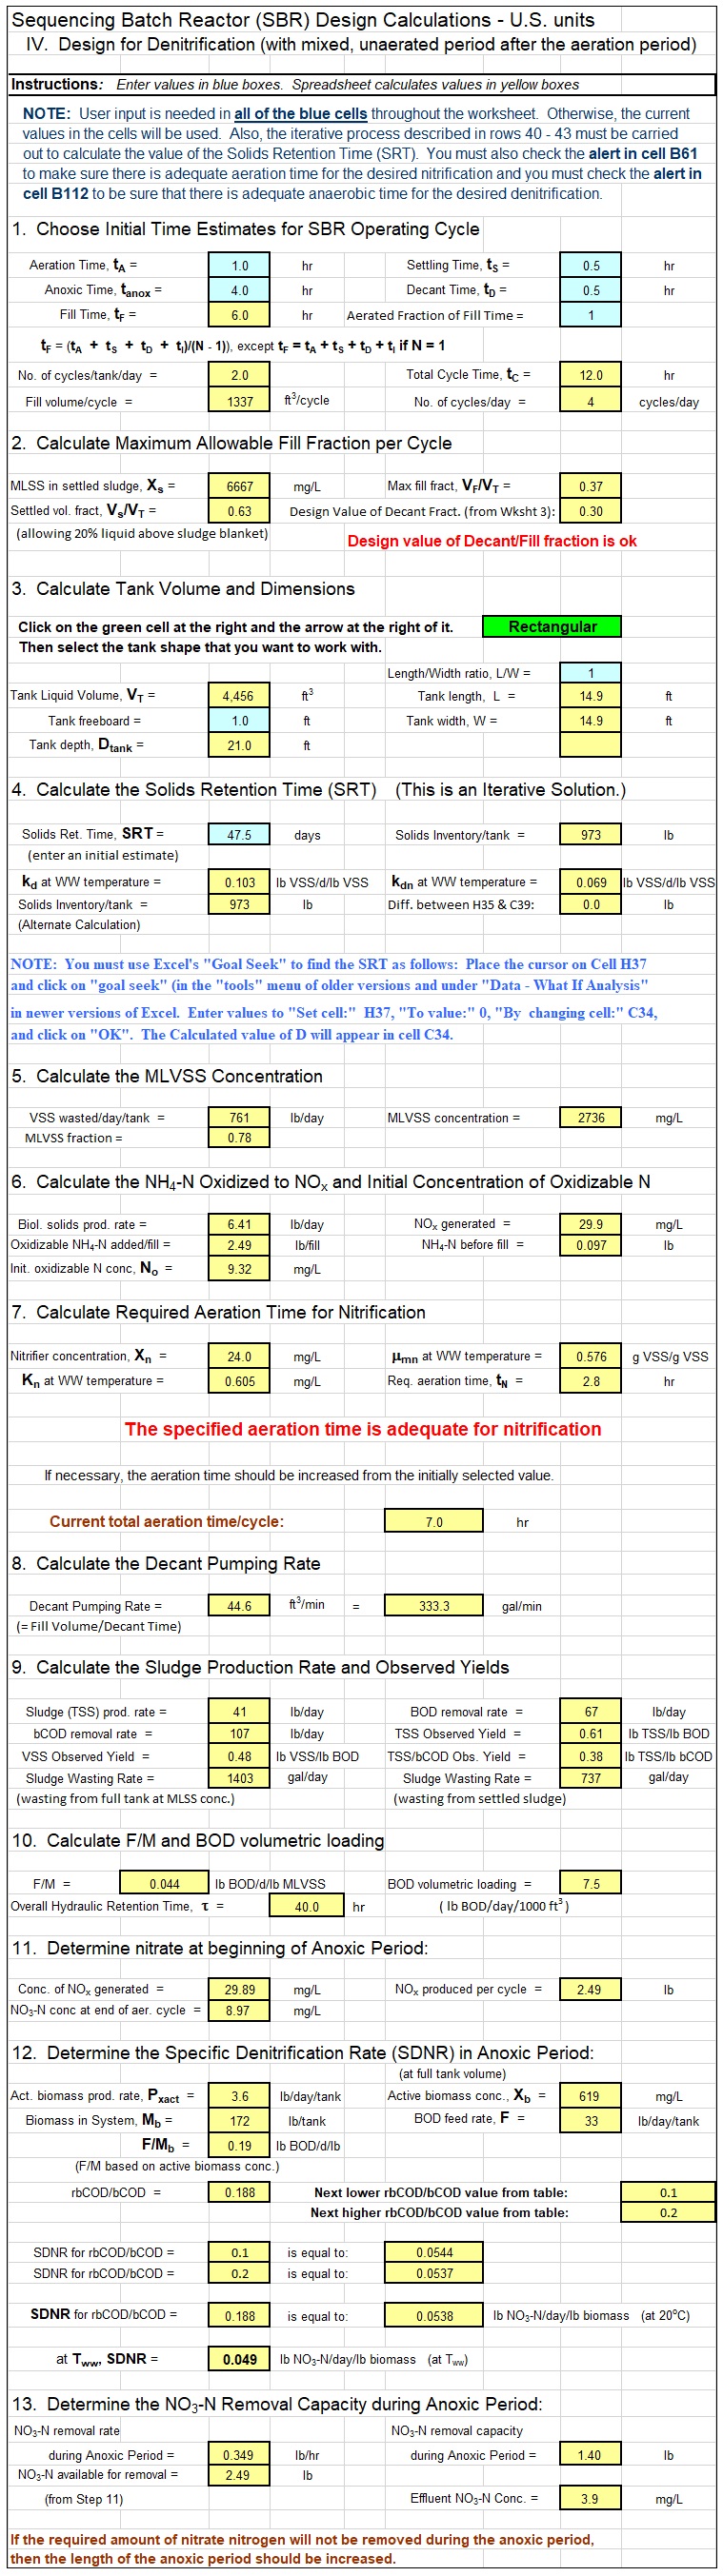
An example SBR denitrification calculations spreadsheet is partially shown in the image below.  This Excel spreadsheet can be used to set the times for the different parts of the SBR operating cycle, calculate the required tank size and check on the adequacy for nitrification and for denitrification.  This Excel spreadsheet, as well as others for wastewater treatment process design calculations, is available in either U.S. or S.I. units for a very reasonable price in our spreadsheet store.

screenshot for SBR denitrification calculations spreadsheet

References:

1. Metcalf & Eddy, Inc, (Revised by Tchobanoglous, G, Burton, F.L, Stensel, H.D.), Wastewater Engineering, Treatment and Reuse, 4th Ed., New York, NY, 2003.

2. Metcalf & Eddy, Inc, (Revised by Tchobanoglous, G, Burton, F.L, Stensel, H.D.), Wastewater Engineering, Treatment and Resource Recovery, 5th Ed., New York, NY, 2014.

3. Bengtson, Harlan H.,  “Sequencing Batch Reactor Denitrification Calculations,” an online blog article.

MBBR Nitrification Denitrification Spreadsheet

Where to Find an MBBR Nitrification  Denitrification Spreadsheet

To obtain an MBBR Nitrification Denitrification spreadsheetclick here to visit our spreadsheet store.  This Excel spreadsheet is intended for MBBR nitrification denitrification process design calculations. You can buy a convenient MBBR Nitrification Denitrification spreadsheet  for a very reasonable price.  This spreadsheet makes MBBR process design calculations for BOD removal, nitrification, and denitrification. including both pre-anoxic and post-anoxic denitrification processes.  It is available in either U.S. units or S.I. units.  Read on for information about using an MBBR process design calculations spreadsheet for nitrification and denitrification.

Background for MBBR Nitrification Denitrification Spreadsheet

The moving bed biofilm reactor (MBBR) appeared relatively recently on the wastewater treatment scene.  It was developed in the 1990’s, and is now used in many countries around the world.

The MBBR wastewater treatment process is quite flexible.  It is used for domestic and industrial wastewater treatment and can be designed for BOD removal alone or in combination with nitrification or with nitrification and denitrification.  It is used as a single stage process or as a two-stage or three-stage process.

The diagram below shows the general configuration of a Pre-anoxic nitrification denitrification MBBR wastewater treatment process.  Denitrification can also be carried out in a Post-Anoxic nitrification denitrification process.

MBBR Nitrification Denitrification Spreadsheet flow diagram

MBBR Pre-Anoxic Nitrification Denitrification Flow Diagram

 Example MBBR Wastewater Treatment Design Spreadsheet

An example MBBR nitrification denitrification spreadsheet is partially shown in the two images below.  This Excel spreadsheet can be used to calculate the required MBBR tank volume and dimensions, based on user input media information and wastewater design flow and characteristics.  This Excel spreadsheet, as well as others for wastewater treatment process design calculations, is available in either U.S. or S.I. units for a very reasonable price in our spreadsheet store.

MBBR Nitrification Denitrification Spreadsheet Screenshot1

Screenshot1 – Pre-anoxic Nitrification Denitrification

MMBR Nitrification Denitrification Spreadsheet Screenshot2

Screenshot2 – Pre-anoxic MBBR Nitrification Denitrification Spreadsheet

 References:

1. McQuarrie, J.P. and Boltz, J.P., Moving Bed Bio-film Reactor Technology: Process Design and Performance, Water Environment Research, Vol 83, No 6, June 2011.

2. Bengtson, Harlan, “MBBR Denitrification Design Spreadsheet,” an online blog article

3. Bengtson, Harlan H., “Biological Wastewater Treatment Process Design Calculations,” available as an Amazon Kindle ebook or as a paperback.

4. Bengtson, Harlan H., “Spreadsheets for MBBR Denitrification Design Calculations,” an Amazon Kindle ebook.

5. Bengtson, Harlan H., “Spreadsheets for MBBR Process Design Calculations,”  available as an Amazon Kindle ebook or as a paperback.

Trickling Filter Design Calculations Spreadsheet

Where to Find a Trickling Filter Design Calculations Spreadsheet using the NRC Formula

To obtain a trickling filter design calculations spreadsheet using the NRC formula, click here to visit our spreadsheet store.  For use in making trickling filter design calculations with the NRC equation, you can buy a convenient trickling filter design calculations spreadsheet for a very reasonable price.  This spreadsheet will use the NRC equations to calculate the trickling filter diameter needed for either a single stage or a two stage system and will calculate the estimated treatment efficiency for a specified trickling filter system, in either U.S. or S.I. units.  Read on for information about a trickling filter design calculation spreadsheet that uses the NRC formula.

Trickling Filter Design Calculations Background

The trickling filter process is widely used for biological wastewater treatment all over the world.  It is an attached growth biological wastewater treatment process.  The aerobic microorganisms grow on a solid medium and the wastewater to be treated flows through the bed.  A flow diagram for a typical single stage trickling filter wastewater treatment plant is shown in the diagram below.  The diagram shows the typical flow pattern through the primary clarifier, trickling filter and secondary clarifier.

trickling filter design calculations spreadsheet flow diagram

Example Trickling Filter Design Calculations Spreadsheet

A trickling filter design calculations spreadsheet  is partially shown in the image below.  It can be used to calculate the trickling filter diameter needed for either a single stage or a two stage trickling filter system using the  NRC formula.  The spreadsheet will also calculate an estimated treatment efficiency for a specified single stage or two stage trickling filter system. This Excel spreadsheet, as well as others for wastewater treatment calculations, is available in either U.S. or S.I. units for a very reasonable price in our spreadsheet store.

Trickling Filter Design Calculations Spreadsheet Screenshot

References for Further Information:

1. Metcalf & Eddy, Inc, (revised by Tchobanoglous, G, Burton, F.L., Stensel, H.D., Wastewater Engineering Treatment and Reuse, 4th Edition, New York, NY, 2003.

2. Vesilind, P.A. and Morgan, S.M., Introduction to Environmental Engineering, 2nd Edition, Belmont, CA, Brooks/Cole, 2004.

3. Bengtson, H. H., “Trickling Filter NRC Equation Spreadsheet“, a blog article at www.EngineeringExcelTemplates.com

Activated Sludge Calculations in a Solids Mass Balance Spreadsheet

Where to Find a Solids Mass Balance Spreadsheet for Activated Sludge Calculations

For Excel solids mass balance spreadsheets to make activated sludge calculations calculations, click here to visit our spreadsheet store.  Obtain a convenient, easy to use spreadsheet for solids mass balance activated sludge calculations for only $22.95. Read on for information about the use of an Excel spreadsheet for estimating the effect of recycle flow, BOD and TSS through solids mass balance activated sludge calculations.

Solids Mass Balance Background for Activated Sludge Calculations

Several streams from sludge treatment processes are typically recycled back into the wastewater treatment plant inflow.  Examples are sludge thickener overflow, anaerobic digester supernatant, aerobic digester supernatant, centrate from centrifuge dewatering, and filtrate from filtration dewatering.  The liquid flow, BOD load, and TSS load in these recycled streams contribute to the wastewater flow to be handled by the mainstream wastewater treatment processes.

An iterative solids mass balance is an organized procedure for estimating the total flow rate, BOD load, and TSS load in the recycled flows from sludge treatment and handling processes.  This type of calculation is illustrated in an eight page example in Metcalf and Eddy (Reference #1).  The flow diagram below shows a typical set of sludge treatment processes and recycle flows for an activated sludge plant.

Solids Flow Diagram for Activated Sludge Calculations


Activated Sludge Calculations Influent and Effluent Inputs for Spreadsheet

General information about the wastewater influent flow and characteristics will need to be input to the spreadsheet along with information about target effluent characteristics.  The screenshot below shows typical influent and effluent inputs needed.

Activated Sludge Calculations Solids Mass Balance Spreadsheet

Solids Mass Balance Activated Sludge Calculations for Each Treatment Process

The next step is solids mass balance calculations for each of the treatment processes, leading to estimates of the recycle flow rate, BOD load and TSS load for each recycle stream.  For a wastewater treatment plant with the flow diagram shown above, there would need to be solids mass balance calculations for the primary clarifier, the aeration tank/secondary clarifier, the sludge thickener, the anaerobic digester, and the sludge dewatering process.  The screenshot below shows typical inputs and outputs for a solids mass balance over a sludge thickener.

Screenshot thickener calculations - Activated Sludge Calculations

Similar calculations would be made for each of the wastewater treatment and sludge treatment/management processes, leading to information about recycle flow rate, BOD load, and TSS load, for each recycle stream as shown in the summary tables in the next section.  After completion of the first iteration, the recycle flowrate, BOD load and TSS load are added to values for those parameters for the incoming wastewater and all of the solids mass balance calculations are repeated in a second iteration.

Summary Tables

The screenshot below shows a set of tables summarizing the results of the calculated recycles flows from the first three iterations of the activated sludge calculations.   Spreadsheets are available to make this type of solids mass balance calculations in either U.S. or S.I. units at a very low cost (only $22.95) in our spreadsheet store.  These spreadsheets are set up to make the solids mass balance calculations for four iterations.

Summary Tables for Activated Sludge Calculations Solids Mass Balance

References

1. Metcalf & Eddy, Inc, (revised by Tchobanoglous, G, Burton, F.L., Stensel, H.D., Wastewater Engineering Treatment and Reuse, 4th Edition, New York, NY, 2003.

2. Bengtson, Harlan H.,  “Activated Sludge Solids Mass Balance Spreadsheet,”  an online blog article.