Where to Find Partially Full Pipe Flow Calculator Spreadsheets
To obtain Excel spreadsheets for partially full pipe flow calculations, click here to visit our spreadsheet store for partially full pipe flow calculator spreadsheets. Read on for information about Excel spreadsheets that can be used as a partially full pipe flow calculator.
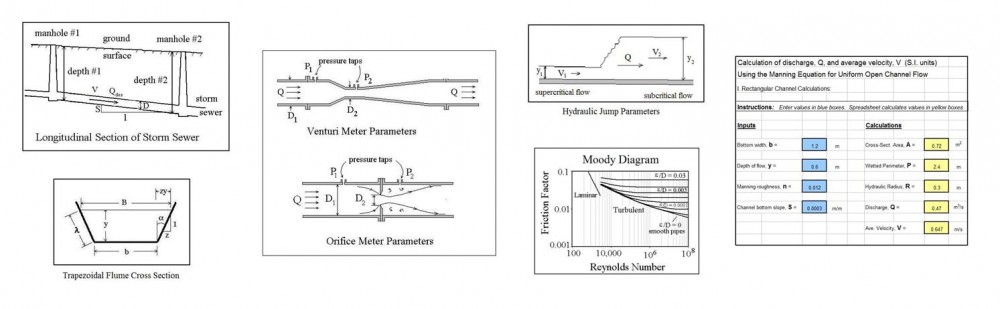
The Manning equation can be used for flow in a pipe that is partially full, because the flow will be due to gravity rather than pressure. the Manning equation [Q = (1.49/n)A(R2/3)(S1/2) for (U.S. units) or Q = (1.0/n)A(R2/3)(S1/2) for (S.I. units)] applies if the flow is uniform flow For background on the Manning equation and open channel flow and the conditions for uniform flow, see the article, “Manning Equation/Open Channel Flow Calculations with Excel Spreadsheets.”
 Direct use of the Manning equation as a partially full pipe flow calculator, isn’t easy, however, because of the rather complicated set of equations for the area of flow and wetted perimeter for partially full pipe flow. There is no simple equation for hydraulic radius as a function of flow depth and pipe diameter. As a result graphs of Q/Qfull and V/Vfull vs y/D, like the one shown at the left are commonly used for partially full pipe flow calculations. The parameters, Q and V in this graph are flow rate an velocity at a flow depth of y in a pipe of diameter D. Qfull and Vfull can be conveniently calculated using the Manning equation, because the hydraulic radius for a circular pipe flowing full is simply D/4.
With the use of Excel formulas in an Excel spreadsheet, however, the rather inconvenient equations for area and wetted perimeter in partially full pipe flow become much easier to work with. The calculations are complicated a bit by the need to consider the Manning roughness coefficient to be variable with depth of flow as discussed in the next section.
Is the Manning Roughness Coefficient Variable for Partially Full Pipe Flow Calculations?
Using the geometric/trigonometric equations discussed in the next couple of sections, it is relatively easy to calculate the cross-sectional area, wetted perimeter, and hydraulic radius for partially full pipe flow with any specified pipe diameter and depth of flow. If the pipe slope and Manning roughness coefficient are known, then it should be easy to calculate flow rate and velocity for the given depth of flow using the Manning Equation [Q = (1.49/n)A(R2/3)(S1/2)], right? No, wrong! As long ago as the middle of the twentieth century, it had been observed that measured flow rates in partially full pipe flow aren’t the same as those calculated as just described. In a 1946 journal article (ref #1 below), T. R. Camp presented a method for improving the agreement between measured and calculated values for partially full pipe flow. The method developed by Camp consisted of using a variation in Manning roughness coefficient with depth of flow as shown in the graph above.
Although this variation in Manning roughness due to depth of flow doesn’t make sense intuitively, it does work. It is well to keep in mind that the Manning equation is an empirical equation, derived by correlating experimental results, rather than being theoretically derived. The Manning equation was developed for flow in open channels with rectangular, trapezoidal, and similar cross-sections. It works very well for those applications using a constant value for the Manning roughness coefficient, n. Better agreement with experimental measurements is obtained for partially full pipe flow, however, by using the variation in Manning roughness coefficient developed by Camp and shown in the diagram above.
The graph developed by Camp and shown above appears in several publications of the American Society of Civil Engineers, the Water Pollution Control Federation, and the Water Environment Federation from 1969 through 1992, as well as in many environmental engineering textbooks (see reference list at the end of this article). You should beware, however that there are several online calculators and websites with equations for making partially full pipe flow calculations using the Manning equation with constant Manning roughness coefficient, n. The equations and Excel spreadsheets presented and discussed in this article use the variation in n that was developed by T.R. Camp.
Excel Spreadsheet/Partially Full Pipe Flow Calculator for Pipe Less than Half Full
 The parameters used in partially full pipe flow calculations with the pipe less than half full are shown in the diagram at the right. K is the circular segment area; S is the circular segment arc length; h is the circular segment height; r is the radius of the pipe; and θ is the central angle.
The equations below are those used, together with the Manning equation and Q = VA, in the partially full pipe flow calculator (Excel spreadsheet) for flow depth less than pipe radius, as shown below.
- h = y
- θ = 2 arccos[ (r – h)/r ]
- A = K = r2(θ – sinθ)/2
- P = S = rθ
The equations to calculate n/nfull, in terms of y/D for y < D/2 are as follows
- n/nfull = 1 + (y/D)(1/3) for 0 < y/D < 0.03
- n/nfull = 1.1 + (y/D – 0.03)(12/7) for 0.03 < y/D < 0.1
- n/nfull = 1.22 + (y/D – 0.1)(0.6) for 0.1 < y/D < 0.2
- n/nfull = 1.29 for 0.2 < y/D < 0.3
- n/nfull = 1.29 – (y/D – 0.3)(0.2) for 0.3 < y/D < 0.5
The Excel template shown below can be used as a partially full pipe flow calculator to calculate the pipe flow rate, Q, and velocity, V, for specified values of pipe diameter, D, flow depth, y, Manning roughness for full pipe flow, nfull; and bottom slope, S, for cases where the depth of flow is less than the pipe radius. This Excel spreadsheet and others for partially full pipe flow calculations are available in either U.S. or S.I. units at a very low cost in our spreadsheet store.

Excel Spreadsheet/Partially Full Pipe Flow Calculator for Pipe More than Half Full
 The parameters used in partially full pipe flow calculations with the pipe more than half full are shown in the diagram at the right. K is the circular segment area; S is the circular segment arc length; h is the circular segment height; r is the radius of the pipe; and θ is the central angle.
The equations below are those used, together with the Manning equation and Q = VA, in the partially full pipe flow calculator (Excel spreadsheet) for flow depth more than pipe radius, as shown below.
- h = 2r – y
- θ = 2 arccos[ (r – h)/r ]
- A = πr2 – K = πr2 – r2(θ – sinθ)/2
- P = 2πr – S = 2πr – rθ
The equation used for n/nfull for 0.5 < y//D < 1 is: n/nfull = 1.25 – [(y/D – 0.5)/2]
An Excel spreadsheet like the one shown above for less than half full flow, and others for partially full pipe flow calculations, are available in either U.S. or S.I. units at a very low cost at www.engineeringexceltemplates.com.
References
1. Bengtson, Harlan H., Uniform Open Channel Flow and The Manning Equation, an online, continuing education course for PDH credit.
2. Camp, T.R., “Design of Sewers to Facilitate Flow,” Sewage Works Journal, 18 (3), 1946
3. Chow, V. T., Open Channel Hydraulics, New York: McGraw-Hill, 1959.
4. Steel, E.W. & McGhee, T.J., Water Supply and Sewerage, 5th Ed., New York, McGraw-Hill Book Company, 1979
5. ASCE, 1969. Design and Construction of Sanitary and Storm Sewers, NY
6. Bengtson, H.H., “Manning Equation Partially Filled Circular Pipes,” An online blog article
7. Bengtson, H.H., “Partially Full Pipe Flow Calculations with Spreadsheets“, available as an Amazon Kindle e-book and as a paperback.


