MBBR Nitrification Denitrification Spreadsheet

Where to Find an MBBR Nitrification  Denitrification Spreadsheet

To obtain an MBBR Nitrification Denitrification spreadsheetclick here to visit our spreadsheet store.  This Excel spreadsheet is intended for MBBR nitrification denitrification process design calculations. You can buy a convenient MBBR Nitrification Denitrification spreadsheet  for a very reasonable price.  This spreadsheet makes MBBR process design calculations for BOD removal, nitrification, and denitrification. including both pre-anoxic and post-anoxic denitrification processes.  It is available in either U.S. units or S.I. units.  Read on for information about using an MBBR process design calculations spreadsheet for nitrification and denitrification.

Background for MBBR Nitrification Denitrification Spreadsheet

The moving bed biofilm reactor (MBBR) appeared relatively recently on the wastewater treatment scene.  It was developed in the 1990’s, and is now used in many countries around the world.

The MBBR wastewater treatment process is quite flexible.  It is used for domestic and industrial wastewater treatment and can be designed for BOD removal alone or in combination with nitrification or with nitrification and denitrification.  It is used as a single stage process or as a two-stage or three-stage process.

The diagram below shows the general configuration of a Pre-anoxic nitrification denitrification MBBR wastewater treatment process.  Denitrification can also be carried out in a Post-Anoxic nitrification denitrification process.

MBBR Nitrification Denitrification Spreadsheet flow diagram

MBBR Pre-Anoxic Nitrification Denitrification Flow Diagram

 Example MBBR Wastewater Treatment Design Spreadsheet

An example MBBR nitrification denitrification spreadsheet is partially shown in the two images below.  This Excel spreadsheet can be used to calculate the required MBBR tank volume and dimensions, based on user input media information and wastewater design flow and characteristics.  This Excel spreadsheet, as well as others for wastewater treatment process design calculations, is available in either U.S. or S.I. units for a very reasonable price in our spreadsheet store.

MBBR Nitrification Denitrification Spreadsheet Screenshot1

Screenshot1 – Pre-anoxic Nitrification Denitrification

MMBR Nitrification Denitrification Spreadsheet Screenshot2

Screenshot2 – Pre-anoxic MBBR Nitrification Denitrification Spreadsheet

 References:

1. McQuarrie, J.P. and Boltz, J.P., Moving Bed Bio-film Reactor Technology: Process Design and Performance, Water Environment Research, Vol 83, No 6, June 2011.

2. Bengtson, Harlan, “MBBR Denitrification Design Spreadsheet,” an online blog article

3. Bengtson, Harlan H., “Biological Wastewater Treatment Process Design Calculations,” available as an Amazon Kindle ebook or as a paperback.

4. Bengtson, Harlan H., “Spreadsheets for MBBR Denitrification Design Calculations,” an Amazon Kindle ebook.

5. Bengtson, Harlan H., “Spreadsheets for MBBR Process Design Calculations,”  available as an Amazon Kindle ebook or as a paperback.

Hydraulic Grade Line – Energy Grade Line Calculator Spreadsheet

Where to Find a Hydraulic Grade Line – Energy Grade Line Calculator Spreadsheet

To obtain a  hydraulic grade line – energy grade line calculator spreadsheet for calculating and plotting HGL and EGL, click here to visit our spreadsheet store.  Intended for use in calculating and plotting HGL and EGL for up to 10 points of stormwater flow along a storm sewer line, you can buy a convenient spreadsheet to make HGL and EGL calculations and plots for a very reasonable price.  This spreadsheet is available in either U.S. or S.I. units.  Read on for information about a storm sewer hydraulic grade line – energy grade line calculator spreadsheet.

Equations for Hydraulic Grade Line and Energy Grade Line

The equations for the Hydraulic Grade Line and Energy Grade Line (EGL) are:

Hydraulic Grade Line - Energy Grade Line Calculator equationsWhere:    HGL

HGL = hydraulic grade line in ft                EGL = energy grade line in ft

P = pressure in psf                                        γ = specific weight in lb/ft3

h = elevation in ft                                         V = velocity in ft/sec

g = acceleration of gravity in ft/sec2

Example Spreadsheet for Hydraulic Grade Line – Energy Grade Line Calculator Plots

A screenshot for a Hydraulic Grade Line – Energy Grade Line calculator  spreadsheet is partially shown in the image below.  This Excel spreadsheet can be used to calculate and plot the energy grade line and hydraulic grade line.  This Excel spreadsheet, as well as others for stormwater management calculations, is available in either U.S. or S.I. units for a very reasonable price in our spreadsheet store.

hydraulic grade line - energy grade line calculator plot

Reference:

Bengtson, Harlan H., Hydraulic Grade Line Calculation Spreadsheet, an informational blog article

A Spreadsheet to Calculate Oxygen Requirement Activated Sludge Process

Where to Find a Spreadsheet to Calculate Oxygen Requirement Activated Sludge Process

To obtain a spreadsheet to calculate oxygen requirement activated sludge processclick here to visit our spreadsheet store.  For use in calculating oxygen requirements and blower specifications, you can buy a convenient spreadsheet to calculate oxygen requirement activated sludge for a very reasonable price.  This spreadsheet will calculate the oxygen requirement and blower specifications for BOD removal or for BOD removal and nitrification for specified wastewater flow and characteristics and diffuser characteristics, in either U.S. or S.I. units.  Read on for information about Excel spreadsheets that can be used to calculate oxygen requirement activated sludge process parameters.

Oxygen Requirement Activated Sludge Background

The theoretical oxygen requirement for BOD removal can be approximated as ranging from  0.90 lb O2/lb BOD removed at an SRT of 5 days to 1.3 lb O2/lb BOD removed at an SRT of 20 days.  This leads to the equation:

O2 requirement in lb/day  =  0.90  +  [(SRT – 5)/(20 – 5)](1.3 – 0.9)(lb/day BOD removed)

A design increase factor (safety factor) is typically multiplied times the calculated oxygen requirement to get the design oxygen transfer rate.  The design oxygen transfer efficiency and the air density at design conditions can then be used to calculate the design air flow rate.  The blower horsepower can then be calculated from the following equation:

Blower hp  =  (Qair)(ΔP)/(229*η)

Where:

  • Qair is the air flow rate in cfm to be delivered by the blower
  • ΔP is the pressure rise across the blower in psi  = outlet pressure – inlet pressure
  • η is the blower efficiency

If oxygen is to be provided for nitrification as well as BOD removal, then additional calculations are needed to estimate the oxygen requirement for nitrification.

Example Spreadsheet to Calculate Oxygen Requirement Activated Sludge Process

A spreadsheet to Calculate oxygen requirement activated sludge process is partially shown in the image below.  It can be used to calculate the oxygen requirement and blower specifications for an activated sludge wastewater treatment system.  This Excel spreadsheet, as well as others for wastewater treatment calculations, is available in either U.S. or S.I. units for a very reasonable price in our spreadsheet store.

A spreadsheet to calculate oxygen requirement activated sludge process

References:

  1.  Bengtson, Harlan H., “Activated Sludge Oxygen Requirement,”  an online blog article.
  2. Bengtson, Harlan H., “Activated Sludge Calculations Spreadsheet: Aeration Tank Calculations,”  an Amazon Kindle e-book.
  3. Bengtson, Harlan H., “Biological Wastewater Treatment Process Design Calculations,”  available as a paperback book or Amazon Kindle e-book

Sequencing Batch Reactor Design Calculation Spreadsheet

Where to Find a Sequencing Batch Reactor Design Calculation Spreadsheet

To obtain a Sequencing Batch Reactor Design Calculation excel spreadsheet, click here to visit our spreadsheet store.  For use in wastewater treatment design calculations, you can buy a convenient sequencing batch reactor design calculation excel spreadsheet for a very reasonable price?  This spreadsheet will make calculations for BOD removal, nitrification, denitrification, and biological phosphorus removal for given information about wastewater flow rate and characteristics, in either U.S. or S.I. units.  Read on for information about Excel spreadsheets that can be used for SBR design calculations.

Sequencing Batch Reactor Design Calculation Background

A typical activated sludge wastewater treatment process operates as a continuous flow process, with incoming wastewater flow coming into a primary clarifier and treated effluent continuously coming off from the secondary clarifier.  A sequencing batch reactor wastewater treatment system, on the other hand, operates as a batch system.  Two or more tanks are required.  While one tank is receiving influent wastewater (the “fill” part of the cycle), another tank is undergoing aeration (the “react” part of the cycle), settling (the “settle” part of the cycle) and decanting of treated effluent (the “decant” part of the cycle).  This is illustrated in the diagram below.

Sequencing Batch Reactor Design Calculation Cycle Diagram

Sequencing Batch Reactor Design Calculation Applications

A sequencing batch reactor wastewater treatment system has a great deal of flexibility.  It can be used for traditional BOD removal and nitrification using the four cycle components shown above.  In that case there may be aeration for at least part of the fill cycle.  If denitrification is to be accomplished also, then there should be no aeration during the fill cycle.  If the SBR wastewater treatment system is to be designed for biological phosphorus removal as well, then an anaerobic react period is needed after the fill portion of the cycle, and an anoxic react is needed after the aerobic react part of the cycle, as shown in the diagram below.

Sequencing Batch Reactor Design Calculation Diagram for phosphorus removal

Example Sequencing Batch Reactor Design Calculation Excel Spreadsheet

The Sequencing Batch Reactor Design Calculation excel spreadsheet partially shown in the image below can be used to make a variety of design calculations for an SBR wastewater treatment system.  Based on input information about the wastewater flow rate and characteristics, as well as the treatment objectives, the spreadsheet leads the user through calculations for deciding on times for each part of the SBR cycle, tank number and size, and checks on the adequacy of the design.  This Excel spreadsheet, as well as others for wastewater treatment calculations, is available in either U.S. or S.I. units for a very reasonable price in our spreadsheet store.

Sequencing Batch Reactor Design Calculations Spreadsheet Screenshot

Reference:

Bengtson, Harlan H.,  “SBR Wastewater Treatment Plant Design Spreadsheet,” an online blog article.

Design Storm Hyetograph Generation Spreadsheet

Where to Find a Design Storm Hyetograph Generation Spreadsheet

To obtain a Design Storm Hyetograph Generation excel spreadsheet, click here to visit our spreadsheet store.  For use in stormwater management calculation, you can buy a convenient Design Storm Hyetograph generation excel spreadsheet for a very reasonable price?  This spreadsheet will generate a design storm hyetograph using the Chicago storm model, a triangular storm model or the “alternating blocks” procedure in either U.S. or S.I. units.  Read on for information about Excel spreadsheets that can be used for design storm hyetograph generation.

Models for Design Storm Hyetograph Generation

Several different hyetograph models can be used for design storm hyetograph generation, including the Chicago storm, triangular, or rectangular (constant intensity design storm) models or the “alternating blocks” procedure for constructing a design storm hyetograph.  An initial step typically needed is the generation of an equation for storm intensity as a function of storm duration at the design location, for the design recurrence interval.

The Chicago Storm Hyetograph

Chicago design storm hyetograph equationFor example, the Chicago storm hyetograph model uses the equation at the left for the portion of the hyetograph before the peak storm intensity.  A slightly different equation is used for the portion of the design Chicago Design Storm Hyetograph Examplestorm hyetograph that is after the peak storm intensity.  The resulting hyetograph has the general shape shown in the diagram at the right.  A user specified parameter is r, which is the fraction of the hyetograph that is before the point of peak storm intensity.  The triangular hyetograph model is similar in shape, but the lines before and after the peak storm intensity are straight instead of curved.

Example Design Storm Hyetograph Generation Excel Spreadsheet

The Design Storm hyetograph generation excel spreadsheet partially shown in the image below can be used to generate a triangular or Chicago storm hyetograph as discussed above.  The portion shown is for generating an equation for storm intensity as a function of storm duration.  This Excel spreadsheet, as well as others for stormwater management calculations, is available in either U.S. or S.I. units for a very reasonable price in our spreadsheet store.

Design Storm Hyetograph Generation Spreadsheet Screenshot

References

1. American Iron and Steel Institute, Modern Sewer Design, 4th Edition, 1999.

2. Bengtson, Harlan H., “Chicago Storm Hyetograph Generation Spreadsheet,”  an online informational blog article.

Air Viscosity Temperature Calculator Spreadsheet

Where to Find an Air Viscosity Temperature Calculator Spreadsheet

To obtain an Air Viscosity Temperature Calculator excel spreadsheet, click here to visit our spreadsheet store.  Why use online calculators or tables to find the viscosity of air at a specified pressure and temperature when you can buy a convenient air viscosity temperature calculator excel spreadsheet for only $4.95?  This spreadsheet will calculate the viscosity of air at specified pressure and temperature in either U.S. or S.I. units.  Read on for information about Excel spreadsheets that can be used as an Air viscosity temperature calculator for specified pressure and temperature.

Air Viscosity Temperature Calculator Spreadsheet Applications

An  Air Viscosity Temperature calculator excel spreadsheet  can be used for any situation where a value of air viscosity is needed at a specified pressure and temperature.  This could include calculations for air flow in a pipe, drag force or drag coefficient calculations for flow of an object through air, and any other calculation requiring the Reynolds number for air flow or flow through air.  For example, see the related article, Fanno Flow Excel Spreadsheet for Air Flow in a Pipe.

Equations for an Air Viscosity Temperature Calculator Spreadsheet

Equations are available for an air viscosity temperature calculator to calculate the viscosity of air at specified temperature and pressure.  The spreadsheet shown in  the diagram below calculates air density using an equation for air viscosity as a function of temperature ratio, Tr , and density ratio, ρr  , where in U.S. units:  Tr   =  T/238.5 with T in degrees R  and ρr    =  ρ/0.6096 with ρ in slugs/ft3.  Since the air density is needed for this calculation, the spreadsheet also calculates the density of air at the specified air temperature and pressure.  The complete equations are included in the spreadsheet discussed above and shown in the screenshot below.

Example Air Viscosity Temperature Calculator Excel Spreadsheet

The Air Viscosity Temperature calculator excel spreadsheet shown in the image below can be used to calculate the viscosity of air at given temperature and pressure as discussed above.  This Excel spreadsheet and others for fluid properties calculations, in either U.S. or S.I. units are available for very reasonable prices in our spreadsheet store.

Air Viscosity Temperature Calculator Spreadsheet

References

1. Bengtson, Harlan H, “Air Viscosity Calculator Pressure Temperature Spreadsheet,”  An online informational blog article.

Manning Equation Open Channel Flow Calculator Excel Spreadsheets

Where to Find a Manning Equation Open Channel Flow Calculator Spreadsheet

To obtain a Manning equation open channel flow calculator excel spreadsheet, click here to visit our spreadsheet store.  Why use online calculators or make open channel flow/Manning Equation calculations by hand when you can buy a variety of Manning equation open channel flow calculator excel spreadsheets or spreadsheet packages for prices ranging from $6.95 to $27.95?  Read on for information about Excel spreadsheets that can be used as a Manning equation open channel flow calculator.

picture for a Manning equation open channel flow calculatorAn excel spreadsheet can conveniently be used as a Manning equation open channel flow calculator.  The Manning equation can be used for water flow rate calculations in either natural or man made open channels.  Uniform open channel flow calculations with the Manning equation use the channel slope, hydraulic radius,  flow depth, flow rate, and Manning roughness coefficient.   Image Credit: geograph.org.uk

Uniform Flow for a Manning Equation Open Channel Flow Excel Spreadsheet

Diagram for a Manning Equation Open Channel Flow Calculator SpreadsheetOpen channel flow may be either uniform flow or nonuniform flow, as illustrated in the diagram at the left.  For uniform flow in an open channel, there is always a constant volumetric flow of liquid through a reach of channel with a constant bottom slope, surface roughness, and hydraulic radius (that is constant channel size and shape).  For the constant channel conditions described, the water will flow at a constant depth (usually called the normal depth) for the  particular volumetric flow rate and channel conditions. The diagram above shows a stretch of uniform open channel flow, followed by a change in bottom slope that causes non-uniform flow, followed by another reach of uniform open channel flow.  The Manning Equation, which will be discussed in the next section, can be used only for uniform open channel flow.

Equation and Parameters for a Manning Equation Open Channel Flow Calculator Excel Spreadsheet

The Manning Equation is:

Q = (1.49/n)A(R2/3)(S1/2) for the U.S. units shown below, and it is:

Q = (1.0/n)A(R2/3)(S1/2) for the S.I. units shown below.

  • Q is the volumetric water flow rate in the reach of channel (ft3/sec for U.S.) (m3/s for S.I.)
  • A is the cross-sectional area of flow  (ft2for U.S.) (m2for S.I.)
  • P is the wetted perimeter of the flow  (ft for U.S.)  (m for S.I.)
  • R is the hydraulic radius, which equalsA/P(ft for U.S.) (m for S.I.)
  • S is the bottom slope of the channel, (dimensionless or ft/ft -U.S. & m/m – S.I.)
  • n is the empirical Manning roughness coefficient, which is dimensionless

The equation V = Q/A, a definition for average flow velocity, can be used to express the Manning Equation in terms of average flow velocity,V, instead of flow rate,Q, as follows:

V = (1.49/n)(R2/3)(S1/2) for U.S. units with V expressed in ft/sec.

Or V = (1.0/n)(R2/3)(S1/2) for S.I. units with V expressed in m/s.

It should be noted that the Manning Equation is an empirical equation.  The U.S. units must be just as shown above for use in the equation with the constant 1.49 and the S.I. units must be just as shown above for use in the equation with the constant 1.0.

The Manning Roughness Coefficient for a Manning Equation Open Channel Flow Calculator Excel Spreadsheet

Manning Equation Open Channel Flow Calculator Manning Roughness CoefficientsAll calculations with the Manning equation (except for experimental determination of n) require a value for the Manning roughness coefficient, n, for the channel surface.  This coefficient, n, is an experimentally determined constant that depends upon the nature of the channel and its surface.  Smoother surfaces have generally lower Manning roughness coefficient values and rougher surfaces have higher values. Many handbooks, textbooks and online sources have tables that give values of n for different natural and man made channel types and surfaces. The table at the right gives values of the Manning roughness coefficient for several common open channel flow surfaces for use in a Manning equation open channel flow calculator excel spreadsheet.

Example Manning Equation Open Channel Flow Excel Spreadsheet

The Manning equation open channel flow calculator excel spreadsheet shown in the image below can be used to calculate flow rate and average velocity in a rectangular open channel with specified channel width, bottom slope, & Manning roughness, along with the flow rate through the channel.  This Excel spreadsheet and others for Manning equation open channel flow calculations for rectangular, trapezoidal or triangular channels, in either U.S. or S.I. units are available for very reasonable prices in our spreadsheet store.

Manning Equation Open Channel Flow Calculator Excel Spreadsheet

References

1. Bengtson, Harlan H., Open Channel Flow I – The Manning Equation and Uniform Flow, an online, continuing education course for PDH credit.

2. U.S. Dept. of the Interior, Bureau of Reclamation, 2001 revised, 1997 third edition, Water Measurement Manual.

3. Chow, V. T., Open Channel Hydraulics, New York: McGraw-Hill, 1959.

4.  Bengtson, Harlan H., “Manning Equation Open Channel Flow Excel Spreadsheets,”  an online blog article, 2012.

5. Bengtson, Harlan H., “The Manning Equation for Open Channel Flow Calculations“, available as an Amazon Kindle e-book and as a paperback.

Backwater Curve Calculations Spreadsheet

Where to Find a Backwater Curve Calculations Spreadsheet

To obtain a backwater curve calculations spreadsheet to calculate surface profiles for non uniform open channel flow, click here to visit our spreadsheet store.  Obtain a convenient, easy to use backwater curve calculations spreadsheet at a reasonable price.  Read on for information about the use of an Excel spreadsheet for non uniform flow open channel surface profile step wise calculations.

Background on Non Uniform and Uniform Open Channel Flow

uniform nonuniform flow diagram - backwater curve calculations spreadsheetsThe diagram at the right illustrates uniform and nonuniform open channel flow.  Uniform flow in an open channel consists of a constant volumetric flow of liquid through a reach of channel with a constant bottom slope, surface roughness, and hydraulic radius (that is constant channel size and shape).  For those constant channel conditions, the water will flow at a constant depth, called the normal depth, for the  particular channel conditions and volumetric flow rate. The diagram shows a reach of uniform open channel flow, followed by a change in bottom slope that causes non-uniform flow, ending with another reach of uniform open channel flow.  This article is about means of calculating the surface profile (depth vs distance down the channel) for a reach of non uniform flow.


Classifications of Non Uniform Open Channel Flow for a Backwater Curve Calculations Spreadsheet

backwater curve calculations spreadsheet - uniform surface profile typesClassifications of Non Uniform Open Channel Flow (Mild or Steep Channel Slope)

The diagram above shows the three possible non uniform flow patterns for a mild slope (channel slope less than the critical slope) and the three for a steep slope (channel slope greater than the critical slope).  The three mild slope classifications are M1, M2, and M3.  The “M” indicates mild slope and the number shows the relationship among depth of flow, y, critical depth, yc, and normal depth, yo , as shown in the diagram.  Similarly the three steep slope classifications are S1, S2, and S3, with the numbers having the same meaning.  The diagram shows a typical physical situation that will give rise to each of these six types of non uniform open channel flow.

The Energy Equation for a Backwater Curve Calculations Spreadsheet

The energy equation (the first law of thermodynamics applied to a flowing fluid), which has many applications in fluid mechanics, can be used for non uniform open channel flow surface profile stepwise calculations.  The diagram below shows the parameters that will be used at each end of a reach of channel with non uniform flow.

Backwater curve calculations spreadsheet - non uniform flow parametersA Reach of Open Channel with Non Uniform Flow

The energy equation written across a reach of channel is illustrated graphically in the diagram above.  The sum of the three items on the upstream end of the channel reach must equal the sum of the three items on the downstream end of the channel reach, giving the equation:

Where the parameters in the equation are as follows:

  • y1 =  the upstream depth of flow in ft (m for S.I. units)
  • y2 =  the downstream depth of flow in ft (m for S.I. units)
  • V1 =  the upstream average velocity in ft/sec (m/s for S.I. units)
  • V2 =  the downstream average velocity in ft/sec (m/s for S.I. units)
  • g  =  the acceleration due to gravity  =  32.17 ft/sec2 (9.81 m/s2 for S.I. units)
  • ΔL  =  the horizontal length of the channel reach in ft (m for S.I. units)
  • So =  the bottom slope of the channel, which is dimensionless
  • Sf =  the slope of the energy grade line (thus head loss is hL = SfΔL)

For specified flow rate, Q, channel bottom slope, So , Manning roughness coefficient, n, and channel width for a rectangular channel, the energy equation can be used to calculate the length, ΔL, for transition from a known upstream depth, y1 , to a selected downstream depth, y2 .  This process can be repeated as many times as necessary to determine the total distance to a specified downstream depth.

The energy equation can be rearranged to give the following equation for ΔL:

The Manning equation is typically used to calculate the slope of the energy grade line, Sf .  Although the Manning equation only applies for uniform flow, the use of mean cross-sectional area and mean hydraulic radius with a relatively small step for the calculation gives a good approximation.  The equation for Sf is as follows:

Sf =  {Qn/[1.49Am(Rhm2/3)]]}2, where  Am is the mean area and Rhmis the mean hydraulic radius between sections 1 and 2.  For S.I. units, the 1.49 constant in this equation becomes 1.00.

Screenshot of a Backwater Curve Calculations Spreadsheet

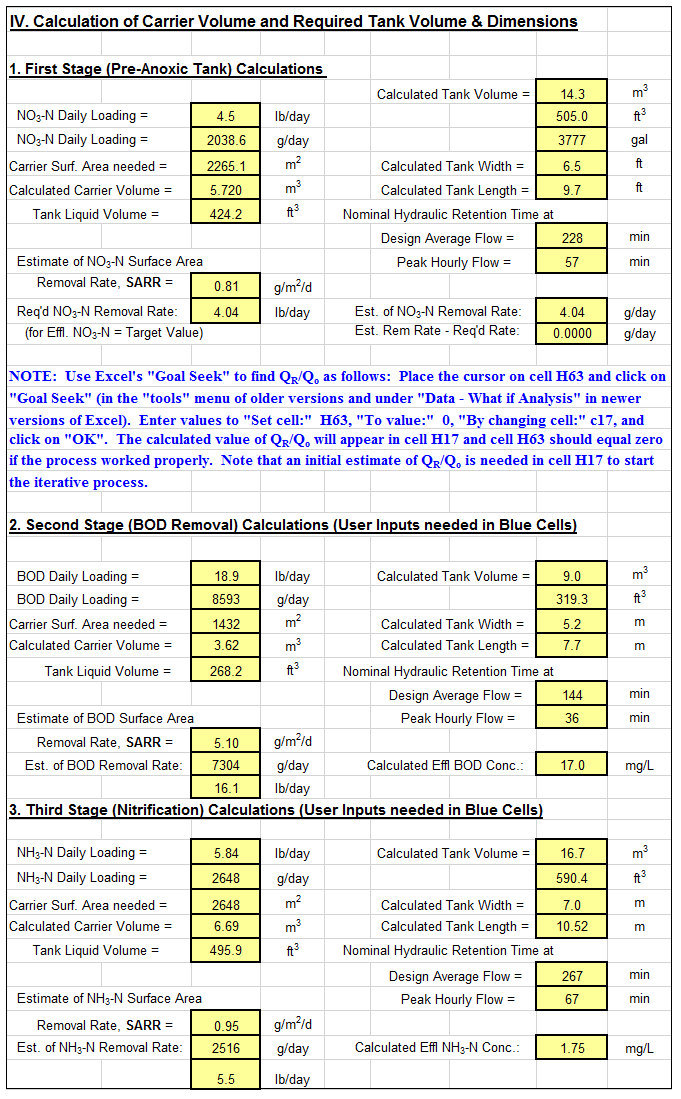
Consider a 20 ft wide rectangular channel with bottom slope equal to 0.0003, carrying 1006 cfs.  The normal depth for this flow is 10 ft.   An M1 backwater curve is generated due to a downstream obstruction.  Calculate the channel length for the transition from a depth of 12 ft to a depth of 12.5 ft in this backwater curve.

Solution: The spreadsheet shown in the screenshot below shows the solution.  It actually has the entire M1 curve from a depth of 10 ft to a depth of 16 ft.  It shows DL for the transition from 12 ft depth to 12.5 ft depth to be 3853 ft.

The Excel spreadsheet template shown above can be used to calculate an M1 surface profile for a rectangular channel with specified flow rate, bottom width, bottom slope, and Manning roughness coefficient.  Why bother to make these calculations by hand?  This backwater curve calculations spreadsheet and others with similar calculations for a trapezoidal channel, and for any of the six mild or steep nonuniform flow surface profiles are available in either U.S. or S.I. units at a very low cost in our spreadsheet store.

References

1. Munson, B. R., Young, D. F., & Okiishi, T. H., Fundamentals of Fluid Mechanics, 4th Ed., New York: John Wiley and Sons, Inc, 2002.

2. Chow, V. T., Open Channel Hydraulics, New York: McGraw-Hill, 1959.

3. Bengtson, Harlan H., Open Channel Flow II – Hydraulic Jumps and Supercritical and Nonuniform FlowAn online, continuing education course for PDH credit.

4.  Bengtson, Harlan H., “Non Uniform Flow in Open Channels“, an online blog article

Flow Through Annulus Calculator Excel Spreadsheet

Where to Find an Excel Spreadsheet Flow Through Annulus Calculator

For an Excel spreadsheet liquid flow through annulus calculatorclick here to visit our spreadsheet store.  Look in the “Non-Circular Duct flow Calculations” category.  Obtain a convenient, easy to use spreadsheet liquid flow through annulus calculator at a reasonable price. Read on for information about the use of Excel spreadsheets to calculate pressure drop or liquid flow rate for annulus flow.

Friction Factor-Pipe Flow Background for a Liquid Flow Through Annulus Calculator

A liquid flow through annulus calculator spreadsheet uses calculations that are very similar to those for flow through a pipe.  The main difference is use of the hydraulic diameter for flow through an annulus in place of the pipe diameter as used for pipe flow.  For details of pipe flow calculations, see the article, “Friction Factor/Pipe Flow Calculations with Excel Spreadsheets.”

Calculation of the Hydraulic Diameter for a Liquid Flow Through Annulus Calculator

The general definition of hydraulic diameter for flow through a non-circular cross-section is:                               DH = 4(A/P),    where:

  • DH is the hydraulic diameter in ft (m for S.I. units)
  • A is the cross-sectional area of flow in sq ft (sq m for S.I. units)
  • P is the wetted perimeter in ft (m for S.I. units)

For a flow through annulus calculator:

  • A = (π/4)(Do2 –  Di2)
  • P  =  π(Do + Di)

Where Do is the inside diameter of the outer pipe and Di is the outside diameter of the inner pipe.  Substituting for A and P in the definition of  DH and simplifying gives:

DH =  Do – Di

Equations for the Liquid Flow Through Annulus Calculator

The Darcy Weisbach equation for flow in an annulus is:  hL = f(L/DH)(V2/2g), with the parameters in the equation as follows: hL is the frictional head loss for flow of a liquid at average velocity, V, through an annulus of length, L, and hydraulic diameter, DH .  The Reynolds number for the flow (Re) and the relative roughness of the pipe (Manning roughness coefficient /pipe diameter, ε/D) are needed to get a value for the friction factor, f.  The Moody friction factor diagram and equations for calculating the friction factor, f, are presented and discussed in the article, “Friction Factor/Pipe Flow Calculations with Excel Spreadsheets.”

Spreadsheets for the Liquid Flow Through Annulus Calculator

The Excel spreadsheet screenshot below shows a liquid flow through annulus calculator spreadsheet for calculation of the head loss and frictional pressure drop for flow of a liquid through an annulus.  Based on the input values for the annulus diameters and length as well as liquid flow rate and properties, the spreadsheet will calculate the head loss and frictional pressure drop.

For low cost, easy to use spreadsheets to make these calculations as well as similar calculations for liquid flow in an annulus or for pipe flow calculations, in S.I. or U.S. units, click here to visit our spreadsheet store.

liquid flow through annulus calculator spreadsheetReferences

1.  Munson, B. R., Young, D. F., & Okiishi, T. H., Fundamentals of Fluid Mechanics, 4th Ed., New York: John Wiley and Sons, Inc, 2002.

2. Bengtson, H.H., Pipe Flow/Friction Factor Calculations with Excel, an online continuing education course for Professional Engineers.

3.  Bengtson, Harlan H.,  Advantages of Spreadsheets for Pipe Flow/Friction Factor Calculations,  an e-book available through Amazon.com.

Partially Contracted V-Notch Weir Excel Spreadsheets

Where to Find a Partially Contracted V-Notch Weir Excel Spreadsheet

To obtain a Partially Contracted V-notch weir Excel spreadsheet for , click here to visit our spreadsheet store. Why use online calculators or hand calculations when you can buy a partially contracted V-notch weir spreadsheet for only $11.95.  Read on for information about Excel spreadsheets that can be used as v-notch weir open channel flow calculators for partially contracted flow.

For background on fully contracted v notch weir calculations, see the article, “V-Notch Weir Calculator Excel Spreadsheet.”   That article gives general information about V notch weirs and equations and conditions required for fully contracted v notch weir calculations.

Partially Contracted V Notch Weir Calculations for a 90o Notch Angle

Partially contracted v-notch weir excel spreadsheet diagram

The equation shown below is recommended by the U.S. Dept. of the Interior, Bureau of Reclamation in their Water Measurement Manual (ref #1 below) for calculations with a partially contracted, 90o, v notch, sharp crested weir with free flow conditions and 0.4 ft < H < 2 ft (0.05 m < H < 0.38 m).

In U. S. units:  Q = 4.28H2.48, where Q is discharge in cfs and H is head over the weir in ft.

In S.I. units:  Q = 1.36H2.48, where Q is discharge in  m3/s and H is head over the weir in m.

The conditions for the v notch weir to be fully contracted are:

H/P < 1.2,    H/B < 0.4,    P > 0.33 ft (0.1 m),   B > 2 ft (0.6 m)

The diagram above shows the parameters H, P, θ and B for a v notch weir as used for open channel flow rate measurement in a partially contracted v-notch weir excel spreadsheet.

Screenshot of a Partially Contracted V Notch Weir Excel Spreadsheet

The screenshot below shows a partially contracted v notch weir excel spreadsheet for making 90o, partially contracted v-notch weir calculations in U.S. units.  Based on specified values for H, P, & B (and a value for Ce from a graph on the spreadsheet), the spreadsheet checks on whether the required conditions for partially contracted flow are met and then calculates the flow rate, Q.  This Excel spreadsheet and others for v notch weir calculations are available in either U.S. or S.I. units at a very low cost (only $11.95)  in our spreadsheet store.

partially contracted v-notch weir spreadsheet screenshot

References:

1. U.S. Dept. of the Interior, Bureau of Reclamation, 2001 revised, 1997 third edition, Water Measurement Manual, available for online use or download at: http://www.usbr.gov/pmts/hydraulics_lab/pubs/wmm/index.htm.

2. Bengtson, Harlan H., “Sharp Crested Weirs for Open Channel Flow Measurement,” an Amazon Kindle ebook

3. Bengtson, Harlan H., Open Channel Flow III – Sharp Crested Weirs, an online continuing education course for PDH credit, http://www.online-pdh.com/engcourses/course/view.php?id=87

4. Munson, B. R., Young, D. F., & Okiishi, T. H., Fundamentals of Fluid Mechanics, 4th Ed., New York: John Wiley and Sons, Inc, 2002.