Horizontal Flow Grit Chamber Spreadsheet

Where to Find a Horizontal Flow Grit Chamber Spreadsheet

To obtain a spreadsheet for Horizontal Flow Grit Chamber Design, click here to visit our spreadsheet store.  This Excel spreadsheet has worksheets for calculating the peaking factor and for calculating the required dimensions for the horizontal flow grit chamber based on user input values for several parameters . There is also a worksheet for design of the exit sutro weir to control the horizontal velocity in the grit chamber. You can buy a convenient horizontal flow grit chamber spreadsheet for a very reasonable price.  It is available in either U.S. units or S.I. units.  Read on for background information about a Horizontal Flow Grit Chamber Design spreadsheet.

Background for a Horizontal Flow Grit Chamber Design Spreadsheet

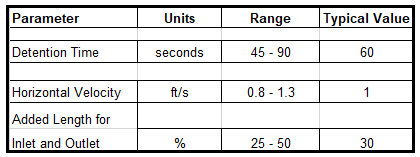
The size and dimensions of a horizontal flow grit chamber are typically based on the detention time and horizontal velocity. Table 1, shown below, gives typical values for the design parameters, detention time and horizontal velocity, as well as typical added length for .the inlet and outlet.

Table 1. Typical Values for Design Parameters for Horizontal flow Grit Chamber

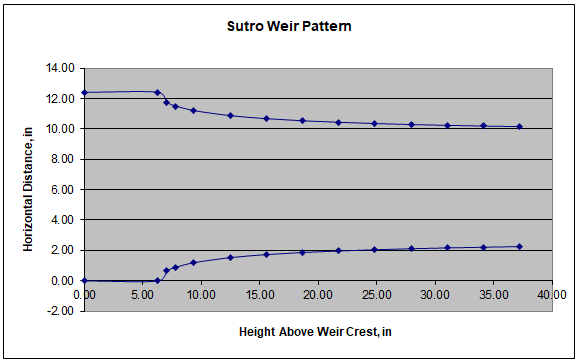
Exit Sutro Weir Design

A sutro weir is typically used as the exit from a horizontal flow grit chamber, because it maintains a constant horizontal velocity through the grit chamber. The diagram below shows the shape of a sutro weir, as plotted for an example horizontal flow grit chamber.

Sutro Weir pattern from spreadsheet

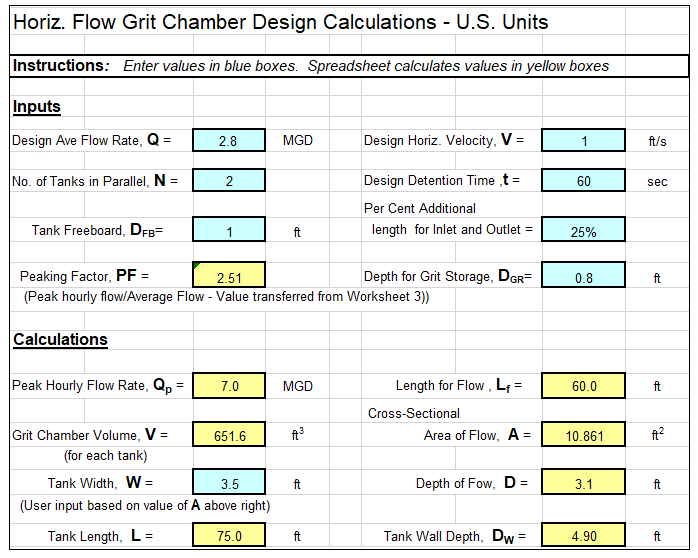
Example Horizontal Flow Grit Chamber Spreadsheet

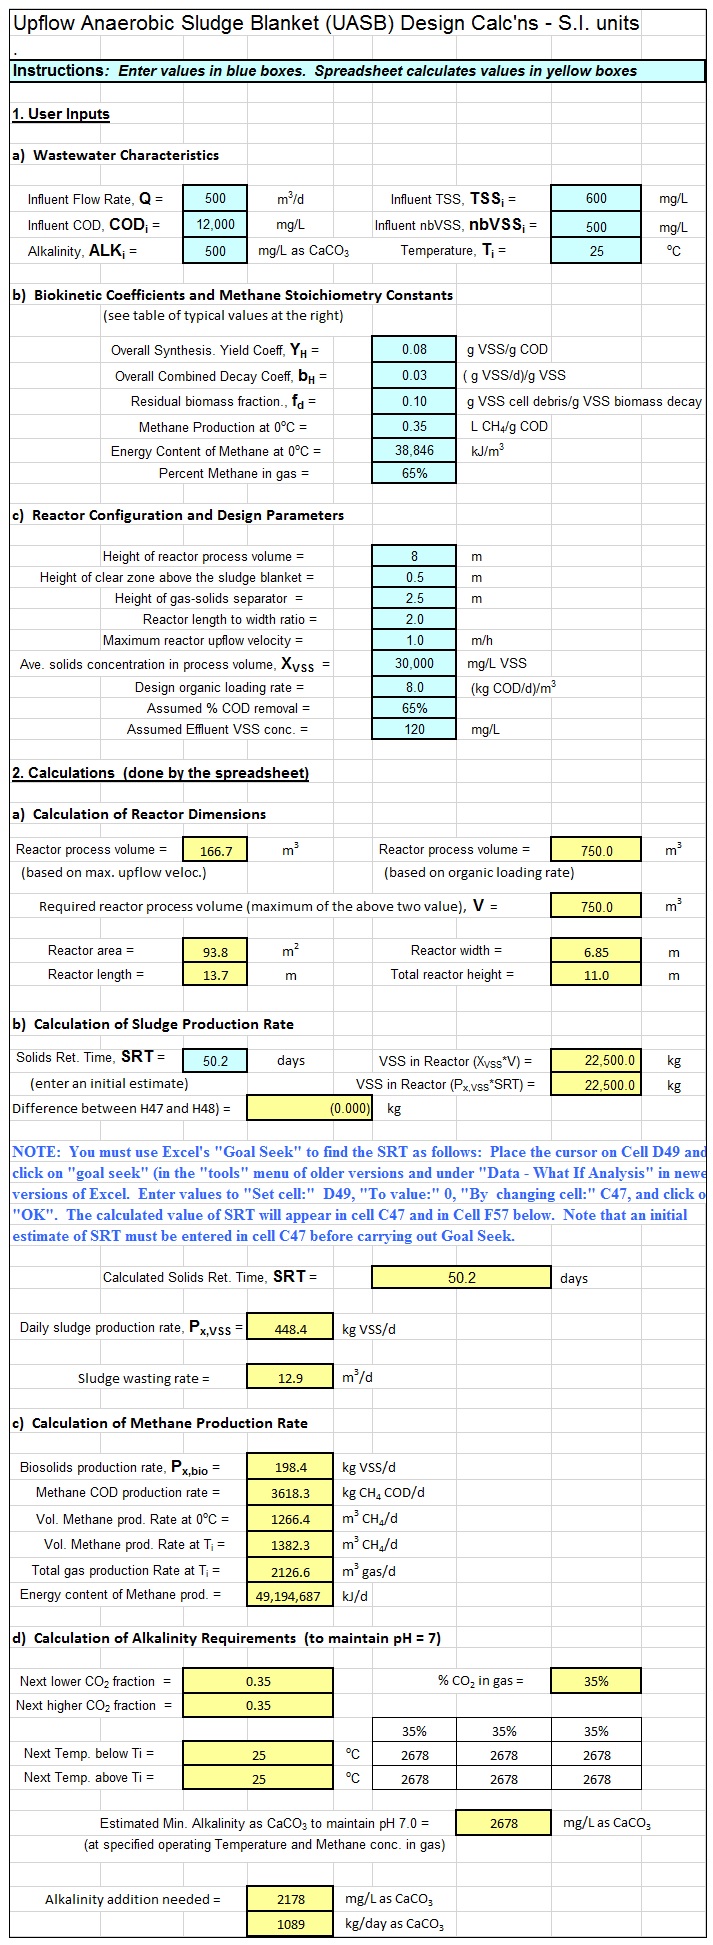
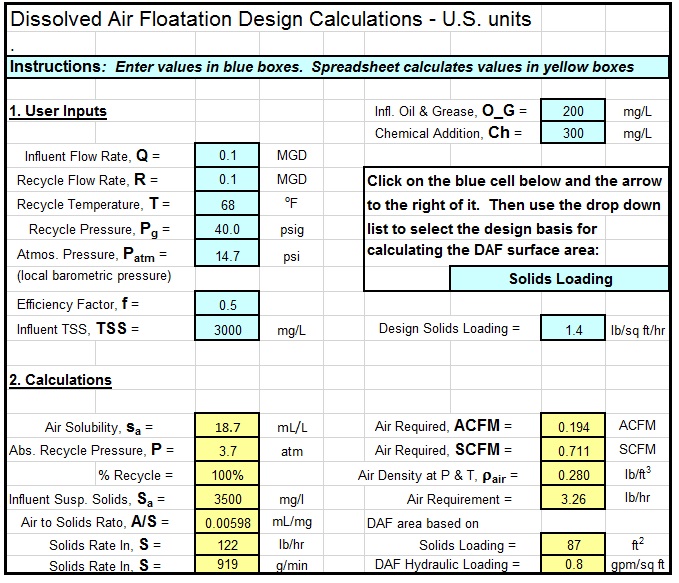
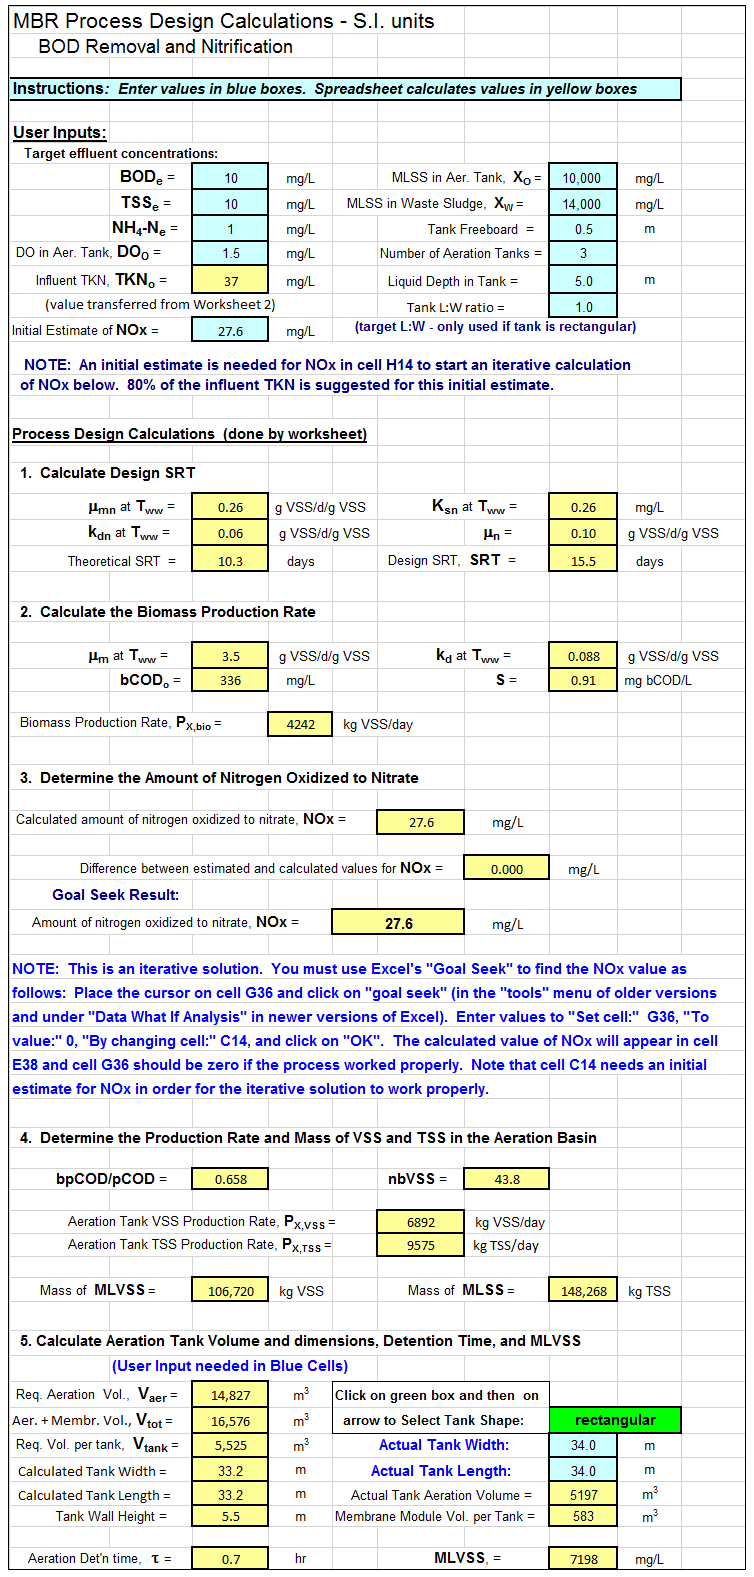
An example Horizontal Flow Grit Chamber Design spreadsheet is partially shown in the image below.  .  This Excel spreadsheet can be used to calculate the required tank volume, tank length and tank depth, .based on user input values for wastewater flow rate, design horizontal velocity, detention time, and tank width..  This Excel spreadsheet, as well as others for water and wastewater treatment calculations, is available in either U.S. or S.I. units for a very reasonable price in our spreadsheet store.n

Horizontal Flow Grit Chamber Spreadsheet Screenshot

References:

1. Metcalf & Eddy, Inc, (Revised by Tchobanoglous, G, Burton, F.L, Stensel, H.D.), Wastewater Engineering, Treatment and Resource Recovery, 5th Ed., New York, NY, 2014.

2. Bengtson, Harlan H.,  “Horizontal Flow Grit Chamber Design Calculations,” an online blog article.

Wastewater Metal Precipitation Spreadsheet

Where to Find a Wastewater Metal Precipitation Spreadsheet

To obtain a Wastewater Metal Preciptitation Spreadsheetclick here to visit our spreadsheet store.  This Excel spreadsheet has worksheets for calculating equilibrium values and design values for precipitation of seven metals from wastewater, based on user input values for several parameters . You can buy a convenient metal hydroxide preciptiation spreadsheet for a very reasonable price.  It is available in either U.S. units or S.I. units.  Read on for background information about a Wastewater Metal Precipitation Spreadsheet.

Background for a Wastewater Metal Precipitation Spreadsheet

To make calculation for metal hydroxide precipitation from wastewater, data for the solubility of that metal vs pH can be used to obtain an equation for the metal hydroxide solubility as a function of pH.  An example graph for zinc solubility vs pH is shown below.

Wastewater Metal Precipitation Spreadsheet Zn vs pH graphUsing an equation like that shown on the graph, equilibrium values can be calculated for effluent metal concentration, chemical usage and solids production.  Application of a safety factor will give design values for effluent metal concentration, chemical usage and solids production.

Example Wastewater Metal Precipitation Spreadsheet

An example wastewater metal precipitation spreadsheet is partially shown in the image below.  .  This Excel spreadsheet can be used to calculate equilibrium and design values for effluent metal concentration, chemical usage and solids production.based on user input values for wastewater flow rate, metal concentrations, design safety factor, and chemical used and its purity, .  This Excel spreadsheet, as well as others for water and wastewater treatment calculations, is available in either U.S. or S.I. units for a very reasonable price in our spreadsheet store.

References:

1. Metcalf & Eddy, Inc, (Revised by Tchobanoglous, G, Burton, F.L, Stensel, H.D.), Wastewater Engineering, Treatment and Reuse, 4th Ed., New York, NY, 2003.

2. Metcalf & Eddy, Inc, (Revised by Tchobanoglous, G, Burton, F.L, Stensel, H.D.), Wastewater Engineering, Treatment and Resource Recovery, 5th Ed., New York, NY, 2014.

3. Bengtson, Harlan H.,  “Wastewater Metal Precipitation Calculations,” an online blog article.

Wastewater Screening Calculations Spreadsheet

Where to Find a Wastewater Screening Calculations Spreadsheet

To obtain a Wastewater Screening Calculations Spreadsheetclick here to visit our spreadsheet store.  This Excel spreadsheet has worksheets for calculating the head loss through a bar screen, head loss through a fine screen, estimated daily volume of screenings collected for a fine screen and for a bar screen, based on user input values for several parameters . You can buy a convenient wastewater screening calculations spreadsheet for a very reasonable price.  It is available in either U.S. units or S.I. units.  Read on for background information about a Wastewater Screening Calculations Spreadsheet.

Background for a Wastewater Screening Calculations Spreadsheet

For information about making calculations for wastewater screening, including bar screens and perforated screens (also known as fine screens).  The equation used to calculate the head loss across a bar screen is:

Wastewater Screening Calculations Spreadsheet equationWhere:

Wastewater Screening Calculations Spreadsheet variablesThe liquid velocity in the approach channel can be calculated using the Manning Equation and the liquid velocity going through the screen can be calculated if information about the number of bars, space between bars, channel width, and flow depth are known.

An equation for calculating the head loss across a fine screen is also available as a function of the flow rate through the screen, the discharge coefficient for the screen (typically 0.6 for a clean screen, and the effective open area of the submerged screen.

Example Wastewater Screening Calculations Spreadsheet

An example wastewater screening calculations spreadsheet is partially shown in the image below.  .  This Excel spreadsheet can be used to calculate the head loss across either a bar screen or a perforated screen and an estimate of the daily screenings volume for either a bar screen or a perforated screen.based on several user input values.  This Excel spreadsheet, as well as others for water and wastewater treatment calculations, is available in either U.S. or S.I. units for a very reasonable price in our spreadsheet store.

Wastewater Screening Calculations Spreadsheet ScreenshotReferences:

1. Metcalf & Eddy, Inc, (Revised by Tchobanoglous, G, Burton, F.L, Stensel, H.D.), Wastewater Engineering, Treatment and Reuse, 4th Ed., New York, NY, 2003.

2. Metcalf & Eddy, Inc, (Revised by Tchobanoglous, G, Burton, F.L, Stensel, H.D.), Wastewater Engineering, Treatment and Resource Recovery, 5th Ed., New York, NY, 2014.

3. Bengtson, Harlan H.,  “Fine Screen and Bar Screen Calculations,” an online blog article.

EBPR A2O Design Calculations Spreadsheet

Where to Find an EBPR A2O Design Calculations Spreadsheet

To obtain an EBPR A2O Design Calculations Spreadsheetclick here to visit our spreadsheet store.  This Excel spreadsheet is intended for making design calculations for pre-anoxic denitrification and enhanced biological phosphorus removal in a CMAS (completely mixed activated sludge) system. You can buy a convenient EBPR A2O Design Calculations Spreadsheet for a very reasonable price.  It is available in either U.S. units or S.I. units.  Read on for background information about EBPR A2O Design Calculations.

Background for an EBPR A2O Design Calculations Spreadsheet

Enhanced Biological Phosphorus Removal  can be carried out with the A2O (Anaerobic, Anoxic process, as shown in the diagram below.

EBPR A2O Design Calculations Spreadsheet process flow diagramThe primary effluent goes first to an anaerobic tank, then to an anoxic tank and then to the aerated activated sludge tank.  The recycle flows include an internal reycle (IR) flow from the aeration tank effluent to the anoxic tank, and recycle activated sludge from the secondary clarifier underflow to the anaerobic tank.

 Example EBPR A2O Design Calculations Spreadsheet

An example EBPR design calculations spreadsheet is partially shown in the image below.  This Excel spreadsheet can be used to calculate the required anaerobic tank size, and calculate the phosphorus removal rate and sludge production rate.  This Excel spreadsheet, as well as others for wastewater treatment process design calculations, is available in either U.S. or S.I. units for a very reasonable price in our spreadsheet store.

EBPR A2O Design Calculations Spreadsheet ScreenshotReferences:

1. Metcalf & Eddy, Inc, (Revised by Tchobanoglous, G, Burton, F.L, Stensel, H.D.), Wastewater Engineering, Treatment and Resource Recovery, 5th Ed., New York, NY, 2014.

2. Bengtson, Harlan H.,  “EPBR Design Calculations Spreadsheet” an online blog article.

MBBR MBR SBR Spreadsheets

Where to Find MBBR MBR SBR Spreadsheets

To obtain MBBR MBR SBR spreadsheetsclick here to visit our spreadsheet store. You can buy your choice of several different MBBR MBR SBR spreadsheets as a convenient MBBR-MBR-SBR spreadsheet bundle or Excel spreadsheets for wastewater treatment design for MBBR wastewater treatment, MBR wastewater treatment or SBR wastewater treatment for very reasonable prices.  This Excel spreadsheet bundle include process design calculations for MBBR wastewater treatment processes, MBR wastewater treatment processed, SBR wastewater treatment processes.   These Excel spreadsheets are available in either U.S. units or S.I. units.  Read on for more information about MBBR MBR SBR Spreadsheets.

MBBR processes in Wastewater Treatment Spreadsheet Bundles

MBBR wastewater treatment process design spreadsheets are included in all of the MBBR-MBR-SBR spreadsheet bundle mentioned above.  The MBBR wastewater treatment process is quite flexible.  It is used for domestic and industrial wastewater treatment and can be designed for BOD removal alone or in combination with nitrification or with nitrification and denitrification.  It is used as a single stage process or as a two-stage or three-stage process.

The diagram below shows the general configuration of a Pre-anoxic nitrification denitrification MBBR wastewater treatment process.  Denitrification can also be carried out in a Post-Anoxic nitrification denitrification process.

MBBR MBR SBR Spreadsheets MBBR Flow Diagram

Figure 1. MBBR Wastewater Treatment Flow Diagram for Pre-Anoxic Deniitrification

MBR Processes in Wastewater Treatment Spreadsheet Bundles

A membrane bioreactor wastewater treatment system (MBR) can provide a compact alternative to the conventional activated sludge process. The MBR process uses filtration through a membrane instead of secondary clarification, so it produces a very high quality effluent.  Primary clarification is not typically used in a membrane bioreactor wastewater treatment system.  Fine screening is needed as a minimum pretreatment, and depending upon wastewater characteristics, coarse screening and grit removal may be needed also. The diagram below shows a general flow diagram for a MBR wastewater treatment system for BOD removal and nitrification.

MBBR MBR SBR Spreadsheet - MBR Process Flow DiagramFigure 2. MBR Wastewater Treatment Flow Diagram for BOD Removal and Nitrification

Currently the membrane module is typically immersed in the aeration tank as shown in the flow diagram.  Denitrification can also be carried out by adding a preanoxic tank before the aeration tank.

 References:

1. McQuarrie, J.P. and Boltz, J.P., Moving Bed Bio-film Reactor Technology: Process Design and Performance, Water Environment Research, Vol 83, No 6, June 2011.

2. Bengtson, Harlan, “MBBR-MBR-SBR Spreadsheet Bundle,” an online blog article

3. Bengtson, Harlan, “MBR Wastewater Treatment Process Design,” an online blog article

3. Bengtson, Harlan H., “Biological Wastewater Treatment Process Design Calculations,” available as an Amazon Kindle ebook or as a paperback.

Wastewater Treatment Spreadsheet Bundles

Where to Find Wastewater Treatment Spreadsheet Bundles

To obtain wastewater treatment spreadsheet bundlesclick here to visit our spreadsheet store. You can buy your choice of several different convenient wastewater treatment excel spreadsheet bundles  for a very reasonable prices.  These Excel spreadsheet bundles include process design calculations for MBBR wastewater treatment processes, MBR wastewater treatment processed, SBR wastewater treatment processes, activated sludge design calculations, and several other wastewater treatment processes.  These Excel spreadsheets are available in either U.S. units or S.I. units.  Read on for more information about these wastewater treatment spreadsheet bundles.

Available Wastewater Treatment Spreadsheet Bundles

The wastewater treatment spreadsheet bundles available from the EngineeringExcelTemplates.com DOWNLOADS page are “Biological-Secondary Wastewater Treatment Bundle“,  “Nitrification and Denitrification Bundle“, “Wastewater Treatment Complete Spreadsheet Bundle“. and “MBBR-MBR-SBR Spreadsheet Bundle”.

Descriptions of these spreadsheet bundles and descriptions of the spreadsheets included in each of them are available through the links in the previous paragraph.

MBBR processes in Wastewater Treatment Spreadsheet Bundles

MBBR wastewater treatment process design spreadsheets are included in all of the wastewater treatment spreadsheet bundles described above.  The MBBR wastewater treatment process is quite flexible.  It is used for domestic and industrial wastewater treatment and can be designed for BOD removal alone or in combination with nitrification or with nitrification and denitrification.  It is used as a single stage process or as a two-stage or three-stage process.

The diagram below shows the general configuration of a Pre-anoxic nitrification denitrification MBBR wastewater treatment process.  Denitrification can also be carried out in a Post-Anoxic nitrification denitrification process.

MBBR process in wastewater treatment spreadsheet bundles

Figure 1. MBBR Wastewater Treatment Flow Diagram for Pre-Anoxic Deniitrification

MBR Processes in Wastewater Treatment Spreadsheet Bundles

A membrane bioreactor wastewater treatment system (MBR) can provide a compact alternative to the conventional activated sludge process. The MBR process uses filtration through a membrane instead of secondary clarification, so it produces a very high quality effluent.  Primary clarification is not typically used in a membrane bioreactor wastewater treatment system.  Fine screening is needed as a minimum pretreatment, and depending upon wastewater characteristics, coarse screening and grit removal may be needed also. The diagram below shows a general flow diagram for a MBR wastewater treatment system for BOD removal and nitrification.

MBR flow diagram from Wastewater Treatment Spreadsheet BundlesFigure 2. MBR Wastewater Treatment Flow Diagram for BOD Removal and Nitrification

Currently the membrane module is typically immersed in the aeration tank as shown in the flow diagram.  Denitrification can also be carried out by adding a preanoxic tank before the aeration tank.

 References:

1. McQuarrie, J.P. and Boltz, J.P., Moving Bed Bio-film Reactor Technology: Process Design and Performance, Water Environment Research, Vol 83, No 6, June 2011.

2. Bengtson, Harlan, “MBBR Denitrification Design Spreadsheet,” an online blog article

3. Bengtson, Harlan, “MBR Wastewater Treatment Process Design,” an online blog article

3. Bengtson, Harlan H., “Biological Wastewater Treatment Process Design Calculations,” available as an Amazon Kindle ebook or as a paperback.

SBR Denitrification Calculations Spreadsheet

Where to Find an SBR Denitrification Calculations Spreadsheet

To obtain an SBR Denitrification Calculations Spreadsheet, click here to visit our spreadsheet store.  This Excel spreadsheet is intended for making design calculations for either pre-anoxic or post-anoxic denitrification in a sequencing batch reactor. You can buy a convenient SBR denitrification calculations spreadsheet for a very reasonable price.  It is available in either U.S. units or S.I. units.  Read on for background information about sequencing batch reactor denitrification process design calculations.

Background for an SBR Denitrification Calculations Spreadsheet

The sequencing batch reactor is a batch type, fill and draw alternative to the continuous flow activated sludge process for biological wastewater treatment, including BOD removal, nitrification and denitrification.  The typical components of a sequencing batch reactor operating cycle for BOD removal and nitrification are shown in the diagram below.

Typical SBR Cycle for SBR denitrification calculations spreadsheetAt least two tanks are typically used.  In that case, the length of the fill period would be equal to the sum of the times for the react, settle and decant periods.  Thus one tank would be filling while the other tank was going through the react, settle and decant periods and then the roles would be reversed.

In order to achieve denitrification, an anoxic period must be added.  A typical sequencing batch reactor cycle for a post-anoxic denitrification process is shown in the figure below.  A mixed anoxic react period is included after the aerobic react period.

post-anoxic SBR operating cycle for SBR denitrification calculations spreadsheetFor a pre-anoxic denitrification SBR process, some or all of the fill period would be anoxic and there would be no anoxic react period after the aerobic react period.

 Example SBR Denitrification Calculations Spreadsheet

An example SBR denitrification calculations spreadsheet is partially shown in the image below.  This Excel spreadsheet can be used to set the times for the different parts of the SBR operating cycle, calculate the required tank size and check on the adequacy for nitrification and for denitrification.  This Excel spreadsheet, as well as others for wastewater treatment process design calculations, is available in either U.S. or S.I. units for a very reasonable price in our spreadsheet store.

screenshot for SBR denitrification calculations spreadsheet

References:

1. Metcalf & Eddy, Inc, (Revised by Tchobanoglous, G, Burton, F.L, Stensel, H.D.), Wastewater Engineering, Treatment and Reuse, 4th Ed., New York, NY, 2003.

2. Metcalf & Eddy, Inc, (Revised by Tchobanoglous, G, Burton, F.L, Stensel, H.D.), Wastewater Engineering, Treatment and Resource Recovery, 5th Ed., New York, NY, 2014.

3. Bengtson, Harlan H.,  “Sequencing Batch Reactor Denitrification Calculations,” an online blog article.

UASB Design Calculations Spreadsheet

Where to Find a UASB Design Calculations Spreadsheet

To obtain a UASB Design Calculations Spreadsheet, click here to visit our spreadsheet store.  This Excel spreadsheet is intended for making design calculations for the upflow anaerobic sludge blanket wastewater treatment process. You can buy a convenient spreadsheet for making USAB design calculations  for a very reasonable price.  It is available in either U.S. units or S.I. units.  Read on for background information about upflow anaerobic sludge blanket wastewater treatment design calculations.

Background for a UASB Design Calculations Spreadsheet

The upflow anaerobic sludge blanket wastewater treatment process is typically used for treatment or pretreatment of wastewaters with a high BOD concentration.  The process has a sludge blanket in the reactor zone, through which the influent wastewater flows.  Also, the top part of the reactor includes a means for collecting the methane biogas generated by the anaerobic process.  A schematic flow diagram of the process is shown here:

UASB Design Calculations Spreadsheet Flow Diagram

 Example UASB Design Calculations Spreadsheet

An example UASB design calculations spreadsheet is partially shown in the image below.  This Excel spreadsheet can be used to calculate the required UASB reactor volume and dimensions, sludge production rate, methane production rate, and required alkalinity addition based on user input information on wastewater flow and characteristics, biokinetic parameters, methane stoichiometry parameters, and reactor configuration and design parameters.  This Excel spreadsheet, as well as others for wastewater treatment process design calculations, is available in either U.S. or S.I. units for a very reasonable price in our spreadsheet store.

UASB Design Calculations Spreadsheet ScreenshotReferences:

1. Metcalf & Eddy, Inc, (Revised by Tchobanoglous, G, Burton, F.L, Stensel, H.D.), Wastewater Engineering, Treatment and Reuse, 4th Ed., New York, NY, 2003.

2. Metcalf & Eddy, Inc, (Revised by Tchobanoglous, G, Burton, F.L, Stensel, H.D.), Wastewater Engineering, Treatment and Resource Recovery, 5th Ed., New York, NY, 2014.

3. Bengtson, Harlan, “Upflow Anaerobic Sludge Blanket Wastewater Treatment,” an online blog article


Dissolved Air Flotation Design Calculations Spreadsheet

Where to Find a Dissolved Air Flotation Design Calculations Spreadsheet

To obtain a Dissolved Air Flotation Design Calculations Spreadsheet, click here to visit our spreadsheet store.  This Excel spreadsheet is intended for making DAF design calculations. You can buy a convenient spreadsheet for making DAF design calculations  for a very reasonable price.  It is available in either U.S. units or S.I. units.  Read on for background information about dissolved air flotation design calculations.

Background for Dissolved Air Flotation Design Calculations

Dissolved air flotation is an alternative to clarification for removal of fine suspended mater from a water or wastewater stream. It is especially good for fine suspended matter that doesn’t settle out well with regular clarification. The air-solids ratio, A/S, is typically calculated with the following equation:dissolved air flotation design calculations equation for air-solids ratioWhere:  sa is the air solubility, f is an efficiency factor, P is the recycle pressure, R is the recycle flow rate, Sa is the influent suspended solids concentration, and Q is the influent flow rate.  The required DAF area can be calculated based on a design value for DAF hydraulic loading rate or based on a design value for DAF solids loading rate.

 Example Dissolved Air Flotation Design Calculations Spreadsheet

An example dissolved air flotation design calculations spreadsheet is partially shown in the image below.  This Excel spreadsheet can be used to calculate A/S, the needed air to solids ratio, and the required DAF area based on user input information on influent design flow and characteristics.  This Excel spreadsheet, as well as others for wastewater treatment process design calculations, is available in either U.S. or S.I. units for a very reasonable price in our spreadsheet store.

Dissolved Air Flotation Design Calculation Spreadsheet Screenshot References:

1. Metcalf & Eddy, Inc, (Revised by Tchobanoglous, G, Burton, F.L, Stensel, H.D.), Wastewater Engineering, Treatment and Reuse, 4th Ed., New York, NY, 2003.

2. Bengtson, Harlan, “DAF Design Calculations Spreadsheet,” an online blog article

Membrane Bioreactor Wastewater Treatment Calculations Spreadsheet

Where to Find a Membrane Bioreactor Wastewater Treatment Calculations Spreadsheet

To obtain a Membrane Bioreactor Wastewater Treatment Calculations spreadsheetclick here to visit our spreadsheet store.  This Excel spreadsheet is intended for making membrane bioreactor process design calculations. You can buy a convenient membrane bioreactor wastewater treatment calculations spreadsheet  for a very reasonable price.  This spreadsheet .  It is available in either U.S. units or S.I. units.  Read on for information about a membrane bioreactor wastewater treatment calculations spreadsheet.

Background for Membrane Bioreactor Wastewater Treatment Calculations Spreadsheet

A membrane bioreactor wastewater treatment system (MBR) can provide a compact alternative to the conventional activated sludge process. The MBR process uses filtration through a membrane instead of secondary clarification, so it produces a very high quality effluent.  Primary clarification is not typically used in a membrane bioreactor wastewater treatment system.  Fine screening is needed as a minimum pretreatment, and depending upon wastewater characteristics, coarse screening and grit removal may be needed also. The diagram below shows a general flow diagram for a MBR wastewater treatment system for BOD removal and nitrification.

membrane bioreactor wastewater treatment calculations spreadsheet flow diagramFigure 1. MBR Wastewater Treatment Flow Diagram for BOD Removal and Nitrification

Currently the membrane module is typically immersed in the aeration tank as shown in the flow diagram.  Denitrification can also be carried out by adding a preanoxic tank before the aeration tank.

 Example Membrane Bioreactor Wastewater Treatment Calculations Spreadsheet

An example membrane bioreactor wastewater treatment calculations spreadsheet is partially shown in the image below.  This Excel spreadsheet can be used to calculate the required volume and dimensions for the MBR aeration tank, membrane module, and preanoxic tank, based on user input membrane module information and wastewater design flow and characteristics.  This Excel spreadsheet, as well as others for wastewater treatment process design calculations, is available in either U.S. or S.I. units for a very reasonable price in our spreadsheet store.

Membrane Bioreactor Wastewater Treatment Calculations Spreadsheet ScreenshotFigure 2. Screenshot of Membrane Bioreactor Wastewater Treatment Calculations Spreadsheet

 References:

1. Metcalf & Eddy, Inc, (Revised by Tchobanoglous, G, Burton, F.L, Stensel, H.D.), Wastewater Engineering, Treatment and Reuse, 4th Ed., New York, NY, 2003.

2. Zaerpour, Masoud, “Design, Cost & Benefit Analysis of a Membrane Bioreactor,” M.S. Thesis, Department of Environmental and Geomatic Engineering, Politecnico di Milan, Academic Year, 2013-2014.

3. Bengtson, Harlan, “MBR Wastewater Treatment Process Design Spreadsheet,” an online blog article.

4. Bengtson, Harlan H., “Spreadsheets for MBR Wastewater Treatment Process Design Calculations,” an Amazon Kindle ebook.

5. Bengtson, Harlan H., “Biological Wastewater Treatment Process Design Calculations,”  available at Amazon as a Kindle ebook or as a paperback.