Critical Depth Open Channel Flow Spreadsheet

Where to Find a Critical Depth Open Channel Flow Spreadsheet

To obtain a critical depth open channel flow spreadsheet for calculating critical depth and/or critical slope for open channel flow, click here to visit our spreadsheet store.  Read on for information about the use of a critical depth open channel flow spreadsheet for critical depth and critical slope calculations.

The Froude Number and Critical, Subcritical and Supercritical Flow

Any particular example of open channel flow will be critical, subcritical, or supercritical flow.  In general, supercritical flow is characterized by high liquid velocity and shallow flow, while subcritical flow is characterized by low liquid velocity and relatively deep flow.  Critical flow is the dividing line flow condition between subcritical and supercritical flow.

The Froude number is a dimensionless number for open channel flow that provides information on whether a given flow is subcritical, supercritical or critical flow.  The Froude number is defined to be:  Fr = V/(gL)1/2 , where V is the average velocity, g is the acceleration due to gravity, and L is a characteristic length for the particular type of open channel flow.  For flow in a rectangular channel:  Fr = V/(gy)1/2 ,   where y is the depth of flow.  For flow in an open channel with a shape other than rectangular:  Fr = V/[g(A/B)]1/2 , where A is the cross-sectional area of flow, and B is the surface width.

The value of the Froude number for a particular open channel flow situation gives the following information:

  • For Fr < 1, the flow is subcritical
  • For Fr = 1, the flow is critical
  • For Fr > 1, the flow is supercritical

Calculation of Critical Depth

It is sometimes necessary to know the critical depth for a particular open channel flow situation.  This type of calculation can be done using the fact that Fr = 1 for critical flow.  It is quite straightforward for flow in a rectangular channel and a bit more difficult, but still manageable for flow in a non-rectangular channel.

For flow in a rectangular channel (using subscript c for critical flow conditions), Fr = 1 becomes:   Vc/(gyc)1/2 = 1.  Substituting Vc =  Q/Ac =  Q/byc and  q = Q/b  (where b = the width of the rectangular channel), and solving for yc gives the following equation for critical depth: yc =  (q2/g)1/3.   Thus, the critical depth can be calculated for a specified flow rate and rectangular channel width.

For flow in a trapezoidal channel, Fr = 1 becomes:  Vc/[g(A/B)c]1/2 = 1.  Substituting the equation above for Vc together with Ac =  yc(b + zyc)    and   Bc =  b  +  zyc2 leads to the following equation, which can be solved by an iterative process to find the critical depth:

Critical Depth Open Channel Flow Spreadsheet Formula1

Calculation of Critical Slope

After the critical depth, yc ,  has been determined, the critical slope, Sc , can be calculate using the Manning equation if the Manning roughness coefficient, n, is known.  The Manning equation can be rearranged as follows for this calculation:

Critical Depth Open Channel Flow Spreadsheet Formula2Note that Rhc , the critical hydraulic radius, is given by:

Rhc =  Ac/Pc,  where Pc =  b  +  2yc(1 + z2)1/2

Note that calculation of the critical slope is the same for a rectangular channel or a trapezoidal channel, after the critical depth has been determined.  The Manning equation is a dimensional equation, in which the following units must be used:  Q is in cfs, Ac is in ft2, Rhc is in ft, and Sc and n are dimensionless.

Calculations in S.I. Units

The equations for calculation of critical depth are the same for either U.S. or S.I. units.  All of the equations are dimensionally consistent, so it is just necessary to be sure that an internally consistent set of units is used.  For calculation of the critical slope, the S.I. version of the Manning equation must be used, giving:

Critical Depth Open Channel Flow Spreadsheet Formula4In this equation, the following units must be used:  Q is in m3/s, Ac is in m2, Rhc is in m, and Sc and n are dimensionless.

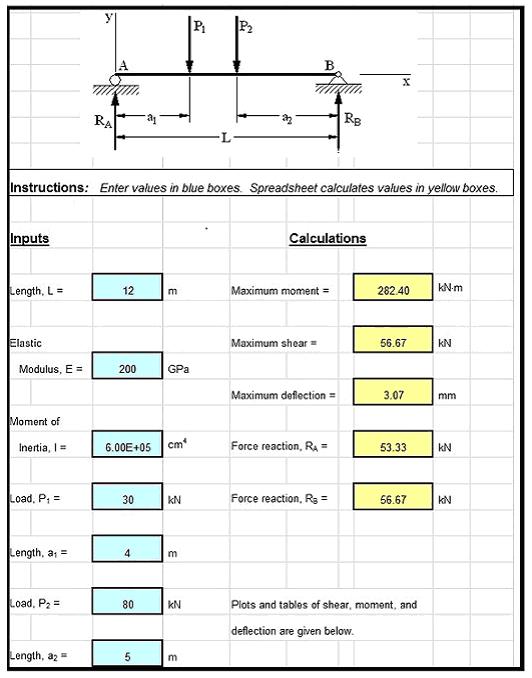
A Critical Depth Open Channel Flow Spreadsheet Screenshot

The critical depth open channel flow spreadsheet template shown below can be used to calculate the critical depth and critical slope for a rectangular channel with specified flow rate, bottom width, and Manning roughness coefficient.  Why bother to make these calculations by hand?  This Excel spreadsheet and others with similar calculations for a trapezoidal channel are available in either U.S. or S.I. units at a very low cost in our spreadsheet store.

Critical Depth Open Channel Flow Spreadsheet Screenshot

References

1. Munson, B. R., Young, D. F., & Okiishi, T. H., Fundamentals of Fluid Mechanics, 4th Ed., New York: John Wiley and Sons, Inc, 2002.

2. Chow, V. T., Open Channel Hydraulics, New York: McGraw-Hill, 1959.

3. Bengtson, Harlan H. Open Channel Flow II – Hydraulic Jumps and Supercritical and Nonuniform FlowAn online, continuing education course for PDH credit.


Using Superposition in a Continuous Beam Analysis Spreadsheet

Where to Find a Continuous Beam Analysis Spreadsheet

To obtain a continuous beam analysis spreadsheet, Click Here to go to our spreadsheet store.    Also, check out our Free Android App for analyzing a simply supported beam with a concentrated load.  Read on for information about performing  continuous beam analyses via superposition and how Excel spreadsheets can be used in this procedure.

The equation giving the deflection of a beam with a complicated loading can often be found relatively easily by superposing two or more deflection equations corresponding to simple loadings.  Superposition can be used, however, only if the beam deflections are small, say less than 1/500-th of the beam span.  Fortunately the vast majority of beams designed by structural and mechanical engineers involve deflections this small or smaller, and thus superposition is applicable to a wide range of practical problems.

Background on Superposition in a Continuous Beam Analysis Spreadsheet

The theoretical justification for superposition is straightforward.  Consider the differential equation for beam deflection, y(x)

in which w(x) is the load acting on the beam, E isthe elastic modulus of the beam material, I is the moment of inertia of the cross section, and x is a horizontal coordinate, measured from the left end and locating points on the beam.  The deflection function y(x) must satisfy Eq. 1 and also the boundary conditions.  For example, for a beam fixed at both ends, the boundary conditions would be

in which L is the length of the beam.

Now suppose that a load w1(x) acts on the beam.  Then the deflection y1(x) of the beam is governed by Eq.1:

Next, remove the load w1(x) and apply a different load, w2(x).  Then the deflection y2(x) of the beam is also governed by Eq.1:

Adding Eqs. 3 and 4 and defining a new function, y3(x) ≡ y1(x) + y2(x), gives

In words, y3(x) satisfies the differential equation for a beam subjected to the combined loading, w1(x) plus w2(x), and, furthermore, y3(x) can be found by simply adding the deflection equations corresponding to w1(x) and w2(x) acting alone (Note that boundary conditions, such as Eq. 2, also are satisfied after superposition).

So why bother with superposition?  Why not just solve Eq. 5 directly for y3(x)?  Answer: Superposition is in fact not worth bothering about, unless tabulated solutions exist for y1(x) and y2(x).  Because if someone else has already solved the differential equations for y1(x) and y2(x) (and the solutions are available to you, typically through a published table of solutions) then all you have to do is add their results—you completely avoid the time-consuming, error-prone process of solving the differential equation for y3(x).

Example Calculations with Beam Formulas

As an illustration, consider the beam shown in the figure below.

For concreteness, let a1 = 2 m, a2 = 3 m, L = 12 m, P1 = 10 kN, P2 = 14 kN, E = 200 GPa, and I = 600 000 cm­4.

The general result for a single load is given by equation (6) below, which is found in all tables of beam deflection formulas:

The deflection equation is

This equation can be used to give the deflection equation y(x) for our two-load problem through superposition

y(x)  =  yo(x, 10 kN, 2 m)  +  yo(x, 14 kN, 9 m)                                                                      (7)

That is, we apply Eq. 6 twice, once for the 10-kN load acting a = 2 m from the left end, and once for the 14-kN load acting a = 12 m − 3 m = 9 m from the left end.

The forms of Eqs. 6 and 7 are well-suited for implementation in a spreadsheet.  We only have to program a single formula (with an “If” statement) representing Eq. 6, and then we can superpose  the results of that formula once for each concentrated load acting on the beam—no matter how many loads act or where they act.  The same superposition approach can be used to calculate the shear and moment diagrams.Obviously, a similar approach can be used for other tabulated solutions, such as those corresponding to a concentrated moment or distributed load acting on the beam.

Screenshot for Continuous Beam Analysis Spreadsheet Calculations

The screenshot image below shows an Excel spreadsheet to calculate the shear and moment diagrams and deflections for two concentrated loads acting on a simply-supported beam.  Note that only the absolute minimum of information is required: the magnitude and location of the loads and the values of E and I.  No nodal numbering, element numbering, boundary condition specification, output specification, and load type must be entered.


The workbook of which this spreadsheet is a part contains tabs for one and two concentrated forces, one and twoconcentrated moments, one and two linearly varying distributed loads, and a combination of all three types of loadings.  The procedure to extend the analysis to other load cases is also presented in a tab.  Because all formulas used in each tab are visible and can be unlocked, userspossessing only a basic knowledge of Excel may easily customize the spreadsheet to meet particular needs and recurrent applications.  This Excel workbook and additional workbooksfor other boundary conditions are available in either U.S. or S.I. units at low cost in our spreadsheet store.

References

1. Manual of Steel Construction, Load & Resistance Factor Design, Volume I, Structural Members, Specifications & Codes, 2nd Edition, American Institute of Steel Construction, Chicago, IL, American Institute of Steel Construction (1994).

2. Egor P. Popov, Engineering Mechanics of Solids, 2nd Edition, Prentice Hall, New York, NY (1998).

3. Rossow, Mark, “Structural Analysis of Beams Spreadsheets,”  an online blog article


Natural Convection Heat Transfer Coefficient Calculator Spreadsheet

Where to Find a Natural Convection Heat Transfer Coefficient Calculator Spreadsheet

For an Excel spreadsheet to use as a natural convection heat transfer coefficient calculatorclick here to visit our spreadsheet store.  Why search for heat transfer coefficient correlations or use online calculators, when you can buy a spreadsheet to use as a natural convection heat transfer coefficient calculator for five different configurations for only $14.95. Read on for information about natural convection heat transfer coefficients and Excel spreadsheets to obtain a value for them.

Convection heat transfer takes place between a solid surface and fluid that is at a different temperature and is in contact with the surface.  If the fluid is flowing past the surface due to an external driving force like a fan or pump, then the heat transfer is called forced convection.  When  fluid motion is due to density differences within the fluid (caused by temperature variation), then the heat transfer is called natural convection or free convection.

Newton’s Law of Cooling for Natural Convection Heat Transfer Coefficient Calculator

Newton’s Law of Cooling [ Q = hA(Ts – Tf) ] is a simple expression used for the rate of convective heat transfer with either forced or natural convection.  The parameters in Newton’s Law of Cooling are:

  • Q, the rate of forced convection heat transfer (Btu/hr – U.S. or W – S.I.)
  • Ts, the solid temperature (oF – U.S. or oC – S.I.)
  • Tf, the fluid temperature (oF – U.S. or oC – S.I.)
  • A, the area of the surface that is in contact with the fluid (ft2 – U.S. or m2 – S.I.)
  • h, the convective heat transfer coefficient (Btu/hr-ft2oF – U.S. or W/m2-K – S.I.)

Dimensionless Nusselt, Rayleigh, Grashof, and Prandtl Numbers

natural convection heat transfer coefficient calculator dimensionless numbersA natural convection heat transfer coefficient calculator typically makes estimations using correlations of dimensionless numbers, specifically correlations of Nusselt number (Nu) with Prandtl number (Pr), Grashof number (Gr), and/or Rayleigh number (Ra), where Ra = GrPr.  The Nusselt, Grashof and Prandtl numbers are defined in the box at the left.

Following is a list of the parameters that appear in these dimensionless numbers, with units are given for both the U.S engineering system and S.I. system of units:

  • D, a characteristic length parameter (e.g. diameter for natural convection from a circular cylinder or a sphere or height of a vertical plate)  (ft for U.S.,  m for S.I.)
  • ρ, the density of the fluid  (slugs/ft3 for U.S.,  Kg/m3 for S.I.)
  • μ, the viscosity of the fluid  (lb-sec/ft2 for U.S.,  N-s/m2 for S.I.)
  • k, the thermal conductivity of the fluid  (Btu/hr-ft-oF for U.S.,  W/m-K for S.I.)
  • Cp, the heat capacity of the fluid  (Btu/lb-oF for U.S.,  J/kg-K for S.I.)
  • g, the acceleration due to gravity (32.17 ft/sec2 for U.S.,  9.81 m/s2 for S.I.)
  • β, the coefficient of volume expansion of the fluid  ( oR for U.S.,  K for S.I.)
  • ΔT, the temperature difference between the solid surface and the fluid  ( oF for U.S., oC or K for S.I.)

The following sections provide equations for estimating the heat transfer coefficient for several common natural convection configurations.

Natural Convection Heat Transfer Calculator for a Vertical Plane

natural convection heat transfer coefficient calculator correlationsThe box at the right shows two correlations for convection heat transfer between a vertical plane and a fluid of different temperature in contact with it.  The first can be used for all values of Rayleigh number and the second is only for laminar flow, indicated by Ra < 109.  The screenshot image below shows an example of an Excel spreadsheet to use as a natural convection heat transfer coefficient calculator for a vertical plate using the two equations shown here.

An Excel Spreadsheet as a Natural Convection Heat Transfer Calculator

For low cost, easy to use Excel spreadsheet packages to use as a natural convection heat transfer coefficient calculator for natural convection from a vertical plane, a horizontal plane, an inclined plane, a horizontal cylinder or a sphere in either U.S. or S.I. units (for only $16.95),  click here to visit our spreadsheet store.

Screenshot of a natural convection heat transfer coefficient calculator spreadsheet

References

1. Incropera, F.P., DeWitt, D.P, Bergman, T.L., & Lavine, A.S., Fundamentals of Heat and Mass Transfer, 6th Ed., Hoboken, NJ, John Wiley & Sons, (2007).

2. Lienhard, J.H, IV and Lienhard, J.H. V, A Heat Transfer Textbook: A Free Electronic Textbook

3. Bengtson, Harlan HFundamentals of Heat Transfer, an online continuing education course for engineering PDH credit

4. Bengtson, Harlan H., Convection Heat Transfer Coefficient Estimation, an online continuing education course for PDH credit.

Sharp Crested Rectangular Weir Flow Calculator Spreadsheet

Where to Find a Rectangular Weir Flow Calculator Spreadsheet

For a rectangular weir flow calculator spreadsheet, click here to visit our spreadsheet store. Obtain a convenient, easy to use spreadsheet to use as a rectangular weir flow calculator at a reasonable price.   Read on for information about Excel spreadsheets that can be used as contracted rectangular weir open channel flow calculators.

The following section, which gives background on sharp crested rectangular weirs in general, also appears in the companion article, “Suppressed Rectangular Weir Calculations with an Excel Spreadsheet

Background on Sharp Crested Rectangular Weirs in General

The picture at the left shows a rectangular weir measuring open channel flow rate in a natural channel.  The diagram below right shows a longitudinal cross-section of a sharp crested weir, with some of the terminology and parameters often used for sharp crested weirs included on the diagram.

The weir crest is the top of the weir. For a rectangular weir it is the straight, levelsharp crested weir parameters for rectangular weir flow calculatorbottom of the rectangular opening through which water flows over the weir. The term nappe is used for the sheet of water flowing over the weir. The equations for calculating flow rate over a weir in this article require free flow, which takes place when there is air under the nappe. The drawdown is shown in the diagram as the decrease in water level going over the weir due to the acceleration of the water.  The head over the weir is shown as H in the diagram; the height of the weir crest is shown as P; and the open channel flow rate in the open channel (and over the weir) is shown as Q.

Image Credits:  Rectangular, Sharp-Crested Weir: flowmeterdirectory.co.uk

Sharp Crested Weir Parameters:  H. H. Bengtson, Ref #2

The Francis Equation for a Rectangular Weir Flow Calculator

contracted rectangular weir diagram for rectangular weir flow calculatorA contracted rectangular weir is one for which the weir extends across only part of the channel, so that the length of the weir, L, is different from as the width of the channel.  The picture at the left shows a contracteded rectangular weir being used to measure the flow of water in a triangular open channel.  The diagram below right shows some of the key parameters used in contracted rectangular weir flow rate calculations. contracted rectangular weir diagram - rectangular weir flow calculator Specifically, the height of the weir crest, P, the head over the weir, H, the weir length, L, and the channel width, B, are shown on the diagram of a contracted rectangular weir in a rectangular channel.  The U.S. Bureau of Reclamation, in their Water Measurement Manual (Ref #1 below), recommend the use of the Francis equation (shown below) for completely contracted rectangular weirs, subject to the condition that  H/L < 0.33,  B – L > 4 Hmax,  and > 2Hmax.

For U.S. units:  Q = 3.33(L – 0.2H)H3/2,  where

  • Q is the water flow rate in ft3/sec,
  • L is the length of the weir in ft,
  • H is the head over the weir in ft,
  • B is the width of the channel in ft, and
  • Hmax is the maximum expected head over the weir in ft.

For S.I. units:  Q = 1.84(L – 0.2H)H3/2, where

  • Q is the water flow rate in m3/sec,
  • L is the length of the weir in m, and
  • H is the head over the weir in m.
  • B is the width of the channel in m, and
  • Hmax is the maximum expected head over the weir in m.

Image Credits:  Contracted Rectangular Weir picture: Food and Agricultural Organization of the United Nations.

Contracted Rectangular Weir Diagram – Bengtson, Harlan H.

The Kindsvater-Carter Formula for a Rectangular Weir Flow Calculator

If any of the three required conditions given in the previous section are not met, then the more general Kindsvater- Carter Equation, shown below should be used.

U.S. units: Q  =  Ce(2/3)[(2g)1/2](L + kb)(H + 0.003)3/2

S.I. units: Q  =  Ce(2/3)[(2g)1/2](L + kb)(H + 0.001)3/2

Ce is a function of L/B and H/P, while  kb is a function of L/B.  There are graphs, tables and equations available for obtaining values for Ce and kb for specified values of L/B and H/P. The equations given below were prepared from information in Reference #3 at the end of the article.

Ce is dimensionless, so the equation for Ce is as a function of L/B and H/P is the same for both S.I. and U.S. units and is as follows:

Ce = α(H/P) + β, where  β = 0.58382 + 0.016218(L/B), and

α = [-0.0015931 + 0.010283(L/B)]/[1 – 1.76542(L/B) + 0.870017(L/B)2]

The equation for kb as a function of L/B has different constants for S.I. and U.S. units.  The two versions of the equation for kb are as follows:

U.S. units: for 0 < L/B < 0.35:   kb = 0.007539 + 0.001575(L/B)  – (kb is in ft)

for 0.35 < L/B < 1.0:  kb = -0.34806(L/B)4 + 0.63057(L/B)3 – 0.37457(L/B)2 + 0.09246(L/B) – 0.000197 (kb is in ft)

S.I. units: for 0 < L/B < 0.35:   kb = 0.002298 + 0.00048(L/B) (kb is in m)

for 0.35 < L/B < 1.0:  kb = -0.10609(L/B)4 + 0.1922(L/B)3 – 0.11417(L/B)2 + 0.028182(L/B) – 0.00006 – (kb is in m)

Note that if H/L < 0.33,  B – L > 4 Hmax,  and P > 2Hmax, then the Francis Equation and the Kindsvater-Carter Equation will give nearly the same value for Q.  As conditions diverge more and more from the requirements, the calculations from the two equations will diverge more and more.  In these cases the value calculated by the Kindsvater-Carter formula should be used.

An Excel Spreadsheet as a Contracted Rectangular Weir Flow Calculator

The Excel spreadsheet template shown below can be used as a contracted rectangular weir flow calculator, using both the Francis equation and the Kindsvater-Carter equation.  Only four input values are needed.  They are the height of the weir crest above the channel invert, P; the width of the channel, B; the weir length L; and the measured head over the weir, H. With these four input values, the Excel formulas will calculate the parameters needed and check on whether the conditions required for use of the Francis equation are met. If the conditions are all met, then the value of Q calculated with the Francis equation can be used.  If any of the conditions aren’t met, then the value of Q calculated with the Kindsvater-Carter formula should be chosen.  This Excel spreadsheet and others for suppressed and contracted rectangular weir calculations are available in either U.S. or S.I. units at a very low cost in our spreadsheet store.

Rectangular weir flow calculator spreadsheet screenshot

References

1. U.S. Dept. of the Interior, Bureau of Reclamation, 2001 revised, 1997, 3rd ed,  Water Measurement Manual

2. Bengtson, H.H., Sharp Crested Weirs for Open Channel Flow Measurement, an Amazon Kindle ebook.

3. Bengtson, H.H., Open Channel Flow Measurement – Weirs and Flumes, An online continuing education course for PDH credit for Professional Engineers

4. Bengtson, H. H., Sharp-Crested Weirs for Open Channel Flow Measurement, An online continuing education course for PDH credit for Professional Engineers.

5. Merkley, Gary P., Weirs for Flow Measurement Open Course Ware, Utah State University.


Suppressed Rectangular Weir Calculations with Excel Spreadsheets

Introduction to Suppressed Rectangular Weir Calculations

For an Excel spreadsheet to make suppressed rectangular weir flow calculations, click here to visit our spreadsheet store.  Read on for information about Excel spreadsheets that can be used as suppressed rectangular weir open channel flow calculators.

As shown in the diagrams and pictures below, the rectangular refers the the shape of the water cross-section as it goes over a sharp crested rectangular weir, which consists of a plate placed in an open channel so that the water is forced to flow through the rectangular open in the weir plate.  It can be used for open channel flow rate measurement, by measuring the height of water above the weir crest (the straight, level top of the weir opening), which can then be used to calculate the water flow rate over the weir.

Background on Sharp Crested Rectangular Weir Calculations in General

suppressed rectangular weir calculations imageThe picture at the left shows a rectangular weir measuring open channel flow rate in a natural channel.  The diagram below right shows a longitudinal cross-section of a sharp crested weir, with some of the terminology and parameters often used for sharp crested weirs included on the diagram.

The weir crest is the top of the weir. For a rectangular weir it is the straight, level suppressed rectangular wier calculatons longitudinal sectionbottom of the rectangular opening through which water flows over the weir. The term nappe is used for the sheet of water flowing over the weir. The equations for calculating flow rate over a weir in this article require free flow, which takes place when there is air under the nappe. The drawdown is shown in the diagram as the decrease in water level going over the weir due to the acceleration of the water.  The head over the weir is shown as H in the diagram; the height of the weir crest is shown as P; and the open channel flow rate in the open channel (and over the weir) is shown as Q.

Image Credits:  Rectangular, Sharp-Crested Weir: flowmeterdirectory.co.uk

Sharp Crested Weir Parameters:  H. H. Bengtson, Ref #2

The Francis Equation for Suppressed Rectangular Weir Calculations

suppressed rectangular weir calculations pictureA suppressed rectangular weir is one for which the weir extends across the entire channel, so that the length of the weir, L, is the same as the width of the channel, B.  The picture at the left shows a suppressed rectangular weir being used to measure the flow of water in an open channel.  The diagram below right shows some of the key parameters used in suppressed rectangular weir flow rate calculations.  Specifically, the suppressed rectangular weir imageheight of the weir crest, P, the head over the weir, H, and the weir length, L (equal to channel width, B) are shown on the diagram.  The U.S. Bureau of Reclamation, in their Water Measurement Manual (Ref #1 below), recommend the use of the Francis equation (shown below) for suppressed rectangular weirs, subject to the condition that  H/P < 0.33 and H/B < 0.33:

For U.S. units: Q = 3.33 B H3/2, where

  • Q is the water flow rate in ft3/sec,
  • B is the length of the weir (and the channel width) in ft, and
  • H is the head over the weir in ft.

For S.I. units:  Q = 1.84 B H3/2, where

  • Q is the water flow rate in m3/sec,
  • B is the length of the weir (and the channel width) in m, and
  • H is the head over the weir in m.

The same condition for H/P and H/B apply.

Image Credits:  Suppressed Rectangular Weir Picture – U.S. Dept. of the Interior, Bureau of Reclamation, 2001 revised, 1997 third edition, Water Measurement Manual.

Suppressed Rectangular Weir Diagram – Bengtson, Harlan H.

The Kindsvater-Carter Formula for Suppressed Rectangular Weir Calculations

If either of the requirements in the previous section (H/P < 0.33 and H/B < 0.33) are not met the the more general Kindsvater- Carter Equation, shown below should be used.

U.S. units: Q = [0.075(H/P) + 0.602](2/3)[(2g)1/2](L – 0.003)(H + 0.003)3/2

S.I. units: Q = [0.075(H/P) + 0.602](2/3)[(2g)1/2](L – 0.001)(H + 0.001)3/2

Note that if H/P < 0.33 and H/B < 0.33, then the Francis Equation and the Kindsvater-Carter Equation will give nearly the same value for Q.  As H/P and/or H/B increase more and more above the 0.33 limit the calculations from the two equations will diverge more and more.  In these cases the value calculated by the Kindsvater-Carter formula should be used.

An Excel Spreadsheet for Suppressed Rectangular Weir Calculations

The Excel spreadsheet template shown below can be used for suppressed rectangular weir calculations, to calculate the water flow rate over a suppressed rectangular weir, using both the Francis equation and the Kindsvater-Carter equation.  Only three input values are needed.  They are the height of the weir crest above the channel invert, P; the width of the channel, B (which equals the weir length L); and the measured head over the weir, H. With these three input values, the Excel formulas will calculate H/P and H/B. If both of these are less than 0.33, then the value of Q calculated with the Francis equation can be used.  If either of the conditions aren’t met, then the value of Q calculated with the Kindsvater-Carter formula should be chosen.  This Excel spreadsheet and others for suppressed and contracted rectangular weir calculations are available in either U.S. or S.I. units at a very low cost in our spreadsheet store.

suppressed rectangular wier calculations spreadsheet screenshot

References

1. U.S. Dept. of the Interior, Bureau of Reclamation, 2001 revised, 1997, 3rd ed,  Water Measurement Manual

2. Bengtson, H.H., Sharp Crested Weirs for Open Channel Flow Measurement, an Amazon Kindle ebook.

3. Bengtson, H.H., Open Channel Flow Measurement – Weirs and Flumes, An online continuing education course for PDH credit for Professional Engineers

4. Bengtson, H. H., Sharp-Crested Weirs for Open Channel Flow Measurement, An online continuing education course for PDH credit for Professional Engineers.

5. Bengtson, H.H., “A Sharp Crested Rectangular Weir Equations Spreadsheet,” an online blog article.

6. Merkley, Gary P., Weirs for Flow Measurement Open Course Ware, Utah State University.

ISO 5167 Orifice Coefficient Calculation Spreadsheet

Introduction to an ISO 5167 Orifice Coefficient Calculation Spreadsheet

For an ISO 5167 orifice coefficient calculation spreadsheetclick here to visit our spreadsheet store.   Read on for information about Excel spreadsheets that can be used to make these ISO 5167 orifice meter calculations.

When ISO 5167 came out in 1991, it included three standard configurations for the pressure taps in an orifice flow meter and equations to calculate the orifice discharge coefficient for a specified ratio of orifice diameter to pipe diameter for any of those three standard pressure tap configurations.  This provided greater flexibility for orifice meters, because orifice plates with different orifice diameters could be used in a given orifice meter, while still allowing accurate determination of the orifice discharge coefficient.

Background on ISO 5167 Orifice Coefficient Calculation Spreadsheet

ISO 5167 Orifice Coefficient Calculation Spreadsheet DiagramAn orifice meter is a simple device for measuring pipe flow rate through the use of a circular plate with a hole in the center (the orifice plate), held in place between pipe flanges, as shown in the diagram at the left.  The fluid pressure decreases downstream of the orifice plate due to the accelerated flow.  The pressure difference shown in the diagram as P1 – P2 can be measured and used to calculate the flow rate passing through the meter (and thus the pipe flow rate) using the equation shown at the right.  This equation allows calculation of pipe flow rate, Q, for measured pressure difference, P1 – P2, and known density of the fluid, ρ, the ratio of orifice diameter to pipe diameter, β, the cross-sectional area of the orifice, Ao, and the orifice discharge coefficient, Cd.

For more details about the orifice, flow nozzle, and venturi meter, see the article, “Excel Spreadsheets for Orifice and Venturi Flow Meter Calculations.”

ISO 5167 Standard Pressure Tap Locations

Prior to ISO 5167 coming out in 1991, the downstream pressure tap of an orifice meter was typically located at the vena contracta (the minimum jet area downstream of the orifice plate) as shown in the diagram above.  The correlations in place for determining the orifice discharge coefficient were for the downstream pressure tap at the vena contracta.  Unfortunately, the distance of the vena contracta fro the orifice plate changes with orifice diameter, so changing to an orifice plate with a different hole diameter required moving the ISO 5167 Orifice Coefficient Calculation Spreadsheet - pressure tapsdownstream pressure tap in order to be able to accurately estimate the orifice discharge coefficient.

The three standard pressure tap configurations identified for orifice flow meters, known as corner taps, flange taps, and D – D/2 taps, are shown in the diagram at the left.  As shown in the diagram, the distance of the pressure taps from the orifice plate is given as a fixed distance, or as a function of the pipe diameter, independent of the orifice diameter, so the orifice discharge coefficient can be calculated for several orifice diameters in a given orifice meter.

Equations for ISO 5167 Orifice Coefficient Calculation Spreadsheet

Included in ISO 5167 is an equation allowing calculation of the orifice discharge coefficient, Cd, for known values of β (d/D), Reynolds number, Re, and L1 & L2, where L1 is the distance of the upstream pressure tap from the orifice plate and L2 is the distance of the downstream pressure tap from the orifice plate.  For corner taps:  L1 = L2 = 0;  for flange taps:  L1 = L2 = 1″ ;  and for D-D/2 taps:  L1 = D & L2 = D/2.   The ISO 5167 equation for the orifice discharge coefficient is:

Cd – 0.5959 + 0.0312 β2.1 – 0.1840 β8 + 0.0029 β2.5(106/Re)0.75 + 0.0900(L1/D)[β4/(1 – β4)] – 0.0337(L2/D)β3

This equation is usable  to find the orifice discharge coefficient for an orifice flow meter with any of the three standard pressure tap configurations, but not for any other arbitrary values of L1 and L2. The introduction of these standard pressure tap configurations and the equation for Cd, allows a given orifice flow meter to conveniently use different size orifice openings and cover a wide flow measurement range.

An iterative (trial and error) calculation is needed to get a value for Cd, because the upstream velocity needed for Re isn’t known until Cd is known.  The ISO 5167 orifice coefficient calculation spreadsheet template shown in the screenshot at the right will calculate the orifice discharge coefficient based on the indicated input information.  The spreadsheet uses an iterative calculation procedure.  It is necessary to assume a value for Re to start the process and replace that value with the calculated Re as any times as necessary until the two Re values are the same.  This ISO 5167 orifice calculation spreadsheet is available in either U.S. or S.I. units at a very low cost in our spreadsheet store.

References:

1. U.S. Dept. of the Interior, Bureau of Reclamation, 2001 revised, 1997 third edition, Water Measurement Manual.

2. International Organization of Standards – ISO 5167-1:2003 Measurement of fluid flow by means of pressure differential devices, Part 1: Orifice plates, nozzles, and Venturi tubes inserted in circular cross-section conduits running full. Reference number: ISO 5167-1:2003.

3. Bengtson, Harlan H., Flow Measurement in Pipes and Ducts, An online continuing education course.

4. Bengtson, Harlan H., “Orifice and Venturi Pipe Flow Meters: for Liquid Flow or Gas Flow,”  an Amazon Kindle e-book.


Air Density Calculator Excel Spreadsheet

Where to Find an Air Density Calculator Excel Spreadsheet

To find an air density calculator Excel spreadsheet to use as an air density calculator, click here to visit our spreadsheet store.  Why use an online calculator or look in tables, when you can get an air density calculator excel spreadsheet to use as an air density calculator here? Read on for information about Excel spreadsheets that can be used to calculate the density of air (and other gases) at different pressures and temperatures with the ideal gas law.

Gas density background for an Air Density Calculator Excel Spreadsheet

Pressure and temperature have significant effects on the density of gases, so some means of determining the density of air and other gases at specified temperatures and pressures is needed for a variety of fluid mechanics applications.  Fortunately, the ideal gas law provides a means of doing this for many gases over ranges of temperature and pressure that are of interest.

The Ideal Gas Law for use in an Air Density Calculator Excel Spreadsheet

A common form for the ideal gas law equation is PV = nRT, giving the relationship among T, the absolute temperature of the gas; P, its absolute pressure; V, the volume occupied by n moles of the gas; and R, the ideal gas law constant.

The density of the gas can be introduced into this equation, through the fact that molecular weight (MW) has units of mass/mole, so that n = m/MW.  This leads to the ideal gas law written as:  PV = (m/MW)RT.  Solving this equation for m/V (which is equal to the gas density, ρ) gives the following equation for gas density as a function of its MW, pressure and temperature:  ρ = (MW)P/RT.

A commonly used set of U.S. units for this equation is as follows:

ρ = density of the gas in slugs/ft3,

MW = molecular weight of the gas in slugs/slugmole (or kg/kgmole, etc.) (NOTE: MW of air = 29),

P = absolute gas pressure in psia (NOTE: Absolute pressure equals pressure measured by a guage plus atmospheric pressure.),

T = absolute temperature of the gas in oR (NOTE: oR = oF + 459.67)

R = ideal gas constant in psia-ft3/slugmole-oR.

For conditions under which air can be treated as an ideal gas (see the next section), the ideal gas law in this form can be used to calculate the density of air at different pressures and temperatures.

The air density calculator excel spreadsheet template shown in the screenshot below will calculate the density of a gas for specified molecular weight, pressure and temperature.   This Excelair density calculator excel spreadsheet spreadsheet is available at a very reasonable price in our spreadsheet store and can be used with either U.S. or S.I. units.  These spreadsheets also contain tables of critical temperature and critical pressure for several common gases.

But When Can I Use the Ideal Gas Law to Calculate the Density of Air?

A good question indeed, because air and other gases for which you may need a density value are real gases, not ideal gases.  It is fortunate, however, that many real gases behave almost exactly like an ideal gas over a wide range of temperatures and pressures.  The Critical Temp and Press for Air Density Calculator Excel Spreadsheetideal gas law works best for high temperatures (relative to the critical temperature of the gas) and low pressures (relative to the critical pressure of the gas).  See table at the left for values of critical temperature and critical pressure for several common gases.  For many practical, real situations, the ideal gas law gives quite accurate values for the density of air (and many other gases) at different pressures and temperatures.

S.I. Units for the Ideal Gas Law

The ideal gas law is a dimensionally consistent equation, so it can be used with any consistent set of units.  For SI units the ideal gas law parameters are as follows:

ρ = density in kg/m3,

P = absolute gas pressure in pascals (N/m2),

T = absolute temperature in oK (NOTE: oK = oC + 273.15)

R = ideal gas constant in Joules/kgmole-K

References:

1. Bengtson, Harlan H., Flow Measurement in Pipes and Ducts, An online PDH course for Professional Engineers

2. Munson, B. R., Young, D. F., & Okiishi, T. H., Fundamentals of Fluid Mechanics, 4th Ed., New York: John Wiley and Sons, Inc, 2002.

3. Applied Thermodynamics ebook, http://www.taftan.com/thermodynamics/

4. Bengtson, Harlan H., “Gas Property Calculator Spreadsheet,” an Amazon Kindle e-book.


Parshall Flume Discharge Calculation – Open Channel Flow Measurement with Excel

Where to find a Parshall Flume Discharge Calculation Spreadsheet

For a Parshall flume discharge calculation Excel spreadsheet to make open channel flow measurement calculations, click here to visit our spreadsheet store. Obtain a convenient, easy to use Parshall flume discharge calculation spreadsheet at a reasonable price.    Read on for information about Excel spreadsheets that can be used for Parshall flume/open channel flow measurement calculations.

picture for parshall flume discharge calculation spreadsheetParshall flumes are used for a variety of open channel flow measurement.  They are especially good for flows containing suspended solids, as for example the flow in wastewater treatment.  As seen in the picture at the right, the plan view of a Parshall flume is similar to that of a venturi flume, with a converging section, a throat, and a diverging section.  A Parshall flume, however, also has prescribed variations in the channel bottom slope as shown in the diagram in the next section.  Flow rate through a Parshall flume can be calculated based on a measured head, using equations that will be discussed in a later section.  A Parshall flume must be constructed with prescribed dimensions as shown in the next section.

Image Credit:   City of Batavia, Illinois

Flume Configuration and Dimensions for Parshall Flume Discharge Calculations

Plan and sectional view - parshall flume discharge calculationThe diagram at the left shows the general configuration of a Parshall flume with a plan and elevation view.  The width of the throat is typically used to specify the size of a Parshall flume.  The table at the right below, shows the standard dimensions for Parshall flumes with throat widths ranging from 1 ft to 8 ft.  Similar information is available for throat widths down to 1 inch and up to 50 ft.

Such a range of sizes covers a very wide range of flow rates.  A 1 inch flume will carry a flow of 0.03 cfs at 0.2 ft of head, while a 50 ft Parshall flume will carry 3,000 cfs at aParshall Flume Dimensions for Parshall Flume Discharge Calculation head of 5.7 ft.   For the range of throat widths in the table, the other dimensions in the diagram are constant at the following values:

E = 3′-0″,  F = 2′-0″,  G = 3′-0″,

K = 3 inches,  N = 9 inches,

X = 2 inches,  Y = 3′

Free Flow and Submerged Flow in Parshall Flume Discharge Calculation

For “free flow” through a Parshall flume, the flow rate through the throat of the flume is unaffected by the downstream conditions.  For free flow, a hydraulic jump will be visible in the throat of the Parshall flume.  For flow situations where downstream conditions cause the flow to back up into the throat, the hydraulic jump isn’t visible, and the flow is said to be “submerged flow” rather than “free flow.”

The ratio between head measurements at the two locations, Ha and Hb, as shown in the diagram at the left above, can be used as a quantitative criterion to differentiate between free flow and submerged flow.  The values of Hb/Ha for free flow and for submerged flow, for several ranges of throat width from 1″ to 8′ are as follows:

For 1” < W < 3” : free flow for Hb/Ha < 0.5; submerged flow for Hb/Ha > 0.5

For 6” < W < 9” : free flow for Hb/Ha < 0.6; submerged flow for Hb/Ha > 0.6

For 1’ < W < 8’ : free flow for Hb/Ha < 0.7; submerged flow for Hb/Ha > 0.7

For 8’ < W < 50’ : free flow for Hb/Ha < 0.8; submerged flow for Hb/Ha > 0.8

Excel Formulas for Free Flow Parshall Flume Discharge Calculation

The free flow equation for Parshall flume discharge calculation is QfreeC Han, where

  • Qfree = the open channel flow rate through the Parshall flume under free flow conditions, cfs for U.S. units or  m3/s for S.I.
  • Ha = the head measured at the correct point in the converging section of the Parshall flume as described in the previous section,  ft for U.S. units or m for S.I. units
  • C and n are constants for a given Parshall flume throat width, W.

The tables below give the constants C and n in the equations for free flow Parshall flume discharge calculation for both U.S. units and for S.I. units.

constants for Parshall flume discharge calculation - U.S. unitsconstants for Parshall flume discharge calculation - S.I. units


free flow Parshall flume discharge calculation spreadsheet


The screenshot at the right shows a Parshall flume discharge calculation spreadsheet that will calculate flow rate through the Parshall flume under free flow conditions in S.I. units for a selected throat width and a specified value for the measured head.   This Excel spreadsheet and one for submerged flow calculation are available in either U.S. or S.I. units at a very low cost in our spreadsheet store.


Excel Formulas for Submerged Flow Parshall Flume Discharge Calculation

The submerged flow equations for Parshall flume discharge calculation, as used by the Excel formulas in the spreadsheet below, are summarized for U.S. units and for S.I. units in the diagrams below:

submerged flow equations for Parshall flume discharge calculation - U.S. unitssubmerged flow equations for Parshall flume discharge calculation - S.I. units


The primary submerged flow equation Parshall flume discharge calculation is:                QsubmQfree – Qcorr, where

  • Qsubm = the flow rate through the Parshall flume for a submerged flow condition, in cfs for U.S. units or  m3/s for S.I. units
  • Qfree =  the flow rate calculated with the equation, Qfree = C Han, as described in the previous section, in cfs for U.S. units or  m3/s for S.I. units
  • Qcorr is a flow correction factor calculated from the equations shown above for the correct throat width, W, in cfs for U.S. units or  m3/s for S.I. units

submerged flow Parshall flume discharge calculation spreadsheet


The screenshot of an Excel spreadsheet template shown at the left will carry out submerged flow Parshall flume discharge calculation in U.S. units for a selected throat width and a specified value for the measured heads, Ha and Hb.   This Excel spreadsheet and one for free flow calculation are available in either U.S. or S.I. units at a very low cost in our spreadsheet store.


References

1. U.S. EPA, Recommended Practice for the Use of Parshall Flume and Palmer Bowlus Flumes in Wastewater Treatment plants, EPA600/2-84-180, 1984

2. Wahl, Tony L., Equations for Computing Submerged Flow in Parshall Flumes, Bureau of Reclamation, Denver, Colorado, USA

3. U.S. Dept. of the Interior, Bureau of Reclamation, Water Measurement Manual, 2001 revised, 1997 third edition


V Notch Weir Calculator Excel Spreadsheet

Where to Find a V Notch Weir Calculator Excel Spreadsheet

To obtain a V notch weir calculator Excel spreadsheet, click here to visit our spreadsheet store. Why use online calculators or hand calculations when you can buy a V-notch weir calculator excel spreadsheet for only $11.95.  Read on for information about Excel spreadsheets that can be used as v-notch weir open channel flow calculators.

As you can see in the diagrams and picture below, the name, v notch weir, is a good description of the device, simply a v shaped notch in a plate placed in an open channel so that the water is forced to flow through the v notch.  It can be used to measure the open channel flow rate, because the height of water above the point of the v notch can be correlated with flow rate over the weir.  The v-notch weir works well for measuring low flow rates, because the flow area decreases rapidly as the head over the v notch gets small.

Background for Sharp Crested Weirs

Picture for V notch weir calculator excel spreadsheetThe v notch weir is only one of several possible types of sharp crested weirs.  The image at the left shows a picture of a v-notch weir. Acknowledgement of Image Source:              RS Hydro www.rshydro.co.uk                            The diagram below right shows a longitudinal cross-section of a sharp crested weir with several commonly used parameters identified on the diagram.  The weir crest is the term used for the top of the weir.  In the case of a v notch weir, the crest is the point of the v-shaped notch.  The term nappe refers to the sheet of water flowing over the weir.  The equations to bediagram for v notch weir calculator excel spreadsheet  discussed in this article for calculating flow over a v-notch weir require free flow over the weir.  This means that there must be air under the nappe, as shown in the diagram.  The drawdown is the decrease in water level going over the weir caused by the acceleration of the water.  The measurement, H, shown in the diagram is referred to as the head over the weir.  P in the diagram is the height of the weir crest, and the open channel flow rate (also the flow rate over the weir) is shown as Q.

Picture Credit:  U.S. Forest Service

A V Notch Weir Calculator Excel Spreadsheet for a 90 Degree Notch Angle

v notch weir calculator excel spreadsheet diagram

The equation shown below is recommended by the U.S. Dept. of the Interior, Bureau of Reclamation in their Water Measurement Manual (ref #1 below) for calculations with a fully contracted, 90o, v notch, sharp crested weir with free flow conditions and 0.2 ft < H < 1.25 ft.

In U. S. units:  Q = 2.49H2.48, where Q is discharge in cfs and H is head over the weir in ft.

In S.I. units:  Q = 1.36H2.48, where Q is discharge in  m3/s and H is head over the weir in m.

The conditions for the v notch weir to be fully contracted are:

H/P < 0.4,    H/B < 0.2,    P > 1.5 ft (0.45 m),   B > 3 ft (0.9 m)

The diagram above shows the parameters H, P, θ and B for a v notch weir as used for open channel flow rate measurement in a v notch weir calculator excel spreadsheet.

Screenshot of a V Notch Weir Calculator Excel Spreadsheet

The screenshot below shows a v notch weir calculator excel spreadsheet for making 90o, v-notch weir calculations in U.S. units.  Based on specified values for H, P, & S, along with Hmax, the maximum expected head over the weir, the spreadsheet checks on whether the required conditions for fully contracted flow are met and then calculates the flow rate, Q.  This Excel spreadsheet and others for v notch weir calculations are available in either U.S. or S.I. units at a very low cost (only $11.95)  in our spreadsheet store.

References:

1. U.S. Dept. of the Interior, Bureau of Reclamation, 2001 revised, 1997 third edition, Water Measurement Manual, available for online use or download at: http://www.usbr.gov/pmts/hydraulics_lab/pubs/wmm/index.htm.

2. Bengtson, Harlan H., Open Channel Flow III – Sharp Crested Weirs, an online continuing education course for PDH credit, http://www.online-pdh.com/engcourses/course/view.php?id=87

3. Munson, B. R., Young, D. F., & Okiishi, T. H., Fundamentals of Fluid Mechanics, 4th Ed., New York: John Wiley and Sons, Inc, 2002.


Activated Sludge Aeration Tank Design with Excel Spreadsheets

Where to Find Spreadsheets for Activated  Sludge Aeration Tank Design

For Excel spreadsheets to use for activated sludge aeration tank design or operation calculations, click here to visit our spreadsheet store.  Get an easy to use spreadsheet to make a variety of activated sludge aeration tank design calculations for a very reasonable price. Read on for information about activated sludge aeration tank design and operation calculations.

The activated sludge process is widely used for biological wastewater treatment all over the world.  This method of biological wastewater treatment was invented in England in about 1914.  An activated sludge wastewater treatment system always has an aeration tank and secondary clarifier, which function as a unit to remove biodegradable organic matter (biochemical oxygen demand or BOD) and suspended solids from the wastewater and keep the aerobic microorganisms that carry out the treatment in the system.  Most types of activated sludge processes also have a primary clarifier that removes settleable solids from the incoming wastewater before it goes to the aeration tank.  A flow diagram for a typical activated sludge wastewater treatment plant is shown in the diagram below.  The diagram shows the typical flow pattern through the primary clarifier, aeration tank and secondary clarifier mentioned above, plus initial preliminary treatment (screening, flow measurement and grit removal) and disinfection, which is usually the final step in wastewater treatment.

diagram for activated sludge aeration tank design

This article will emphasize the equations, parameters, and calculations for design and operation of the aeration tank/secondary clarifier of an activated sludge plant.

Parameters for Activated Sludge Aeration Tank Design Calculations

Activated Sludge Aeration Tank Design Flow DiagramThe diagram at the left shows a typical flow pattern for a conventional activated sludge aeration tank and secondary clarifier.  Some of the parameters that are typically used in activated sludge aeration tank design calculations are shown for the primary effluent, secondary effluent, waste activated sludge, and recycle activated sludge. The following list shows those parameters, along with some others that are used for activated sludge calculations, with their U.S. and S.I. units.

  • primary effluent flow rate, Qo,  (MGD – U.S. or m3/day – S.I.)
  • primary effluent biochemical oxygen demand (BOD) concentration, So, (mg/L – U.S. or g/m3 – S.I.)
  • primary effluent suspended solids conc., Xo, (mg/L – U.S. or g/m3 – S.I.)
  • aeration tank volume, V, (ft3 – U.S. or m3 – S.I.)
  • aeration tank MLSS (suspended solids conc.), X, (mg/L – U.S. or g/m3 – S.I.)
  • secondary effluent flow rate, Qe,  (MGD – U.S. or m3/day – S.I.)
  • secondary effluent susp.solids conc., Xe, (mg/L – U.S. or g/m3 – S.I.)
  • secondary effluent biochemical oxygen demand (BOD) concentration, Se, (mg/L – U.S. or g/m3 – S.I.)
  • waste activated sludge flow rate, Qw, (MGD – U.S. or m3/day – S.I.)
  • waste activated sludge biochemical oxygen demand (BOD) conc., Sw, (mg/L – U.S. or g/m3 – S.I.)
  • waste activated sludge susp. solids conc., Xw (mg/L – U.S. or g/m3 – S.I.)
  • recycle activated sludge flow rate, Qr, (MGD – U.S. or m3/day – S.I.)
  • Food to Microorganism ratio, F:M, (lb BOD/day/lb MLVSS – U.S. or kg BOD/day/kg MLVSS – S.I.)
  • Hydraulic retention time, HRT, (hours for U.S or S.I.)
  • Sludge retention time (also called sludge age), SRT, (days for U.S. or S.I.)
  • Volumetric loading, VL, (lb BOD/day/1000 ft3 – U.S. or kg BOD/day/m3 – S.I.)
  • % volatile solids in the aeration tank mixed liquor suspended solids, %Vol.

Activated Sludge Aeration Tank Design Calculations with Excel Spreadsheets

The table below shows the typical range of values for three commonly used activated sludge aeration tank design parameters: volumetric loading, hydraulic retention time, and food to microorganism ratio. The table includes design information for three activated sludge variations: conventional plug flow, complete mix, and extended aeration activated sludge plants.

Activated Sludge Aeration Tank Design Parameters Table

The spreadsheet image below uses Excel formulas to calculate the required aeration tank volume based on values provided for the input parameters shown in the spreadsheet: primary effluent flow rate, Qo; primary effluent biochemical oxygen demand (BOD), So; Aeration tank MLSS, X; design volumetric loading, VL; and % volatile solids in the aeration tank, %Vol.  The Excel spreadsheet uses the input data to calculate the design value of aeration tank volume, V, and values for two other design parameters that are sometimes used to size the aeration tank, hydraulic retention time in the aeration tank, HRT, and food to microorganism ratio, F:M, using the following equations.

  • V = [ (8.34*So*Qo)/VL ] (1000)
  • VMGV*7.48/1,000,000
  • HRT = 24*VMG/Qo
  • F:M = (8.34*So*Qo)/(8.34*%Vol*X*VMG)  =  (So*Qo)/(%Vol*X*VMG)

For Excel spreadsheets to make a variety of activated sludge aeration tank design and operation calculations in either U.S. or S.I. units for a very reasonable price, click here to visit our spreadsheet store.

Activated Sludge Aeration Tank Design Calculations Spreadsheet

Activated Sludge Aeration Tank Operational Calculations with Excel Spreadsheets

The table below shows typical ranges for several commonly used operational activated sludge waste water treatment process parameters. Note that the values for all of these parameters remain the same for U.S. or S.I. units.  MLSS concentration will have the S.I. unit of g/m3, which is numerically equal to the U.S. units of mg/L. SRT will have units of days for either the U.S. or S.I. system.  F:M will have the S.I. unit of kg BOD/day/kg MLVSS, which is numerically equal to the U.S. unit of lb BOD/day/lb MLVSS. The % unit for Qr/Qo remains the same for U.S. or S.I. units.

Activated Sludge Aeration Tank Design Operational ParametersThe Excel spreadsheet image shown below uses the input values to calculate the activated sludge operational parameters shown.  The input parameters required are: primary effluent information (flow rate, Qo; BOD, So; and TSS, Xo); TSS in the waste and recycle activated sludge streams, Xw; the aeration tank volume, V; aeration tank MLSS, X; % volatile solids in the MLSS, %Vol; and sludge retention time, SRT.

The activated sludge operational parameters calculated by the Excel formulas in the spreadsheet are: recycle activated sludge flow rate, Qr; waste activated sludge flow rate, Qw, and aeration tank food to microorganism ratio, F:M. The equations used are as follows:

  • Qr = (X – Xo)/(Xw – X)
  • VMGV*7.48/1,000,000
  • Qw = (8.34*VMG*X)/(8.34*SRT*Xw)  =  (VMG*X)/(SRT*Xw)
  • F:M = (8.34*So*Qo)/(8.34*%Vol*X*VMG)  =  (So*Qo)/(%Vol*X*VMG)

For Excel spreadsheets to make a variety of activated sludge aeration tank design and operation calculations in either U.S. or S.I. units at a very reasonable price, click here to visit our spreadsheet store.

Activated sludge aeration tank design and operations spreadsheet

References

References for Further Information:

1. Metcalf & Eddy, Inc, (revised by Tchobanoglous, G, Burton, F.L., Stensel, H.D., Wastewater Engineering Treatment and Reuse, 4th Edition, New York, NY, 2003.

2. Vesilind, P.A. and Morgan, S.M., Introduction to Environmental Engineering, 2nd Edition, Belmont, CA, Brooks/Cole, 2004.

3. Grady, C.P.L., Daigger, G.T., Lim, H.C., Biological Wastewater Treatment, 2nd Edition, New York, NY, Marcel Dekker, Inc., 1999.

4. Bengtson, Harlan H. “Biological Wastewater Treatment Process Design Calculations,” available as an Amazon Kindle e-book and as a paperback.

5. Bengtson, Harlan H., “Activated Sludge Calculations Spreadsheet: Aeration Tank Calculations,” an Amazon Kindle e-book.